Cesare La Ferla
Cesare La Ferla @CesareLaFerla

Performance
All

1.23%2026
2026
-10.04%2025
2025
18.72%2024
2024
34.85%2023
2023
-19.87%2022
2022
11.46%2021
2021
34.9%0%-34.9%
Cesare La Ferla
𝗩𝗜𝗫 & 𝗦𝗣𝟱𝟬𝟬 🔹 Take a look at the attached chart. At the top, you can see the VIX index with specific horizontal levels. Below is the $SPX500 featuring its 200-period moving average. Both charts use a weekly timeframe. I believe these two time series need no introduction. 🔹 What can we... Show More
Cesare La Ferla
𝗡𝗲𝘄 𝗥𝗲𝗰𝗼𝗿𝗱: 𝗚𝗼𝗹𝗱 𝘀𝘂𝗿𝗴𝗲𝘀 𝗽𝗮𝘀𝘁 $𝟰,𝟴𝟬𝟬 𝗮𝗺𝗶𝗱 𝗴𝗹𝗼𝗯𝗮𝗹 𝘁𝗿𝗮𝗱𝗲 𝘁𝗲𝗻𝘀𝗶𝗼𝗻𝘀 Good morning to all investors and followers, 🔹 Gold has kicked off 2026 by shattering records, climbing above $ 4,860 per ounce this Wednesday. The rally is being driven by fresh tariff... Show More
Cesare La Ferla
𝗦𝗘𝗡𝗧𝗜𝗠𝗘𝗡𝗧 𝗦𝗨𝗥𝗩𝗘𝗬 🔹 As we usually do, I am reposting the survey to understand investor sentiment. The more responses the survey receives, the more indicative it will be. 🔹 What direction do you think the stock market will move in over the next 3 months? $SPX500 $AAPL (Apple) $MSFT... Show More
🟢 Bullish
100.00%
⚪ Neutral
100.00%
🔴 Bearish
100.00%
Cesare La Ferla
𝗗𝗜𝗩𝗜𝗗𝗘𝗡𝗗 𝗔𝗥𝗜𝗦𝗧𝗢𝗖𝗥𝗔𝗧𝗦 𝗟𝗜𝗦𝗧 🔹 What are Dividend Aristocrats? They are companies in the S&P 500 that have increased their dividends year after year for at least 25 years. This means they have raised them every year since around 2000, so they increased them during the dot-com... Show More
Cesare La Ferla
𝗕𝗧𝗖: 𝗣𝗘𝗥𝗖𝗘𝗡𝗧 𝗔𝗗𝗗𝗥𝗘𝗦𝗦𝗘𝗦 𝗜𝗡 𝗣𝗥𝗢𝗙𝗜𝗧 🔹 The following chart shows two curves: the price of $BTC (shown in black) and the percentage of addresses in profit (in green). 🔹 As you can see, the curve fluctuates sharply, but the swings are gradually decreasing. Currently, the percentage... Show More
Cesare La Ferla
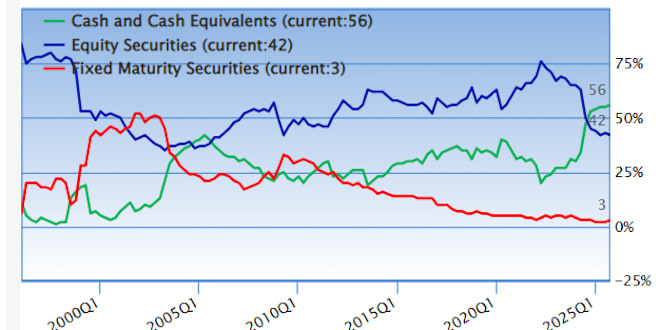
𝗕𝗘𝗥𝗞𝗦𝗛𝗜𝗥𝗘 𝗛𝗔𝗧𝗛𝗔𝗪𝗔𝗬 𝗔𝗦𝗦𝗘𝗧 𝗔𝗟𝗟𝗢𝗖𝗔𝗧𝗜𝗢𝗡 🔹 What assets does $BRK.B (Berkshire Hathaway Inc) hold? 56% cash and cash equivalents 42% equity securities 3% fixed-maturity securities The chart is not perfectly up to date; this allocation is from 2–3 months ago, but I believe... Show More
Cesare La Ferla
𝗕𝗜𝗧𝗖𝗢𝗜𝗡 𝗦𝗣𝗢𝗧 𝗘𝗧𝗙 𝗧𝗢𝗧𝗔𝗟 𝗖𝗨𝗠𝗨𝗟𝗔𝗧𝗜𝗩𝗘 𝗙𝗟𝗢𝗪 🔹 Do you know this chart? It shows the total amount of dollars, expressed in millions, allocated to $BTC ETFs. The value is roughly 60 billion, with a slight decline from the peak reached around September 2025. 🔹 Considering... Show More
Cesare La Ferla
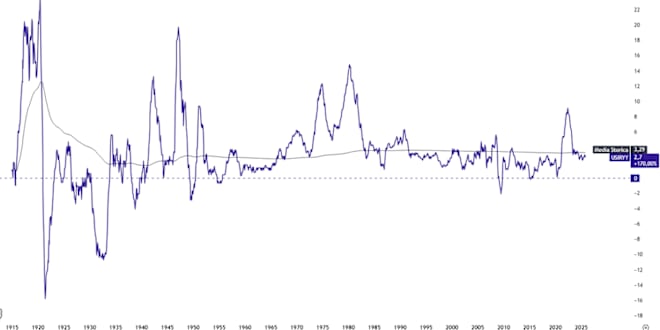
𝗨𝗦 𝗜𝗡𝗙𝗟𝗔𝗧𝗜𝗢𝗡 🔹 U.S. inflation for the month of December stands at 2.7%. The figure matches the forecast made by analysts. The chart shows the trend of inflation over time. 🔹 The data start from around 1915 and are sampled monthly, meaning that each month we have a new inflation figure.... Show More
Cesare La Ferla
𝗣𝗘𝗥𝗖𝗘𝗡𝗧𝗔𝗚𝗘 𝗢𝗙 𝗜𝗡𝗩𝗘𝗦𝗧𝗢𝗥𝗦 𝗟𝗢𝗦𝗜𝗡𝗚 𝗠𝗢𝗡𝗘𝗬 🔹 I like to monitor the percentages of investors losing money across different platforms. In my opinion, the exact value of each platform isn’t very important. I’ve noticed that these data highlight moments of greed, euphoria, or,... Show More
Cesare La Ferla
𝗧𝗛𝗘 𝗜𝗡𝗧𝗘𝗟𝗟𝗜𝗚𝗘𝗡𝗧 𝗜𝗡𝗩𝗘𝗦𝗧𝗢𝗥 🔹 If you consider yourself an investor, you can’t have failed to read The Intelligent Investor by Benjamin Graham at least once. Personally, I always keep it within reach, ready to be opened and leafed through whenever needed. It sits on my bookshelf alongside... Show More

About Cesare La Ferla
Italy
Strategy: Multi-Strategy

Engineer, full time investor. Diversified portfolio with ETFs and crypto.
Show Full Bio
2 Copiers
195 Followers