


Technical analysis indicators can help you to make better-informed trading decisions. High-quality brokers provide these powerful software tools to their clients as part of the standard trading platform package. The trick is learning which technical indicators to use, and when.
What are technical indicators?
Technical indicators are trading tools based on mathematical and statistical formulae. They analyze historical price chart data to give traders an up-to-date view on market conditions, providing an indication as to the direction in which a price might move.
Price history is the key data point for technical indicators. While the indicators generally use this same source data, the underlying formula means that it is interpreted differently by different indicators.
Tip: Technical indicators can be used to trade any asset class, from forex and stocks to commodities and crypto.
Some indicators also incorporate other data sources, such as trading volumes. Traders can access a range of user-friendly trading indicators that can be used to spot trade entry points in both trending or range-bound markets.

Popular tools and indicators
There are a plethora of technical indicators available to traders, including
Moving averages
Moving averages calculate the mean value of the price of an asset over a given set of time intervals. For example, the 20-day simple moving average (SMA) on a daily price chart demonstrates the average price of an asset over the last 20 days.
It is important to use SMA timeframes that match your investment approach. Day traders running shorter-term strategies are more likely to focus on the 1-hour SMA, rather than an SMA that is based on longer-term price moves.
Tip: The exponential moving average (EMA) gives more weight to recent data points.
Bollinger Bands
Bollinger Bands add an additional layer of analysis to moving averages. They have two additional lines or bands: one above and one below the SMA. These outer bands highlight standard deviations of price and, statistically speaking, price should trade within these bands most of the time.
Tip: Some technical indicators are more effective in trending markets, while some are more effective in ranging markets.
Oscillators
Tip: Some tools are typically more accurate when used on longer timeframes, though they can also work in the short term.
Relative Strength Index
The Relative Strength Index (RSI) is an oscillator indicator that compares the magnitude of an asset’s recent gains, relative to its losses. The RSI presents its findings as an index score ranging between 0 and 100.
The closer the RSI is to 100, the greater the chance that the market is currently “overbought”. An RSI closer to 0 points to a market being “oversold”.
Tip: Some indicators can be used to establish the strength of momentum behind a price move.
Stochastics
Stochastics adopt a similar approach to oscillators but give greater weight to the closing price of any time interval. In theory, if the closing price in a market is nearer to the peak of the intraday range, it is a sign of further upward price momentum, and vice versa.
Ranging markets tools and indicators
Some indicators are better suited to trading ranging markets – times when price moves across the chart, rather than forming an upward or downward trend. The example below displays a sell signal moving across the chart suggesting an overbought trend.
| Trading a ranging market — Gold 2024 — Sell signals confirmed by the RSI reading suggesting times when the market is overbought |
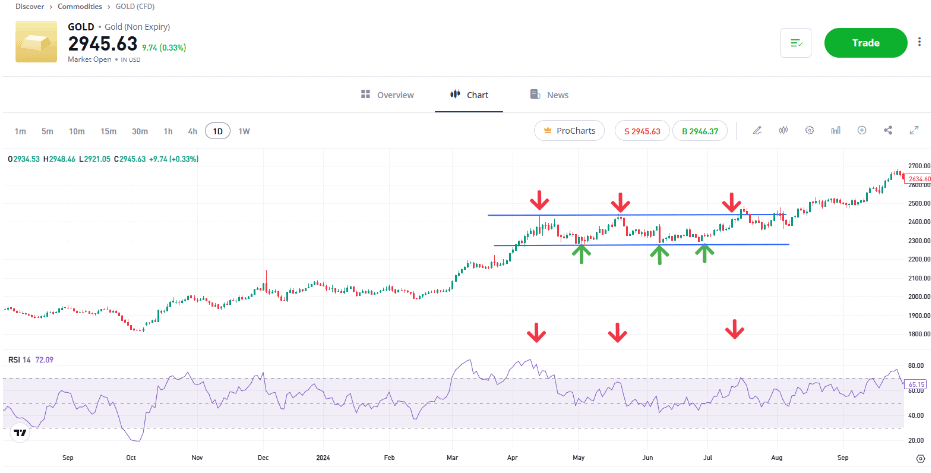
Past performance is not an indication of future results
Source: eToro
The outline of a ranging market will be formed by a pattern showing a lower supporting trendline and a higher resistance trendline. While the underlying market conditions remain the same, the aim is to buy at the bottom and sell at the top of the range.
Oscillators that point to a market being overbought or oversold when price nears one of the outlining trendlines would provide confirmation that a price reversal could be imminent.
Tip: Trend trading strategies are likely to be more effective following a breakout to either side of a ranging market.
Bollinger Bands are also suited to trading range-bound markets. Not only do the outer bands provide an indication of the possible limit of any price move, but also the width of Bollinger Bands is a key indicator.
Narrower bands reflect lower price

Trending markets tools and indicators
Traders can use a variety of market tools and indicators, such as moving averages (MA), to gauge whether to follow the trend direction, and this decision can potentially result in long-term gains. Traders can customize tools to suit their needs into versions including the 20-day or 50-day MA.
Some technical indicators incorporate data points that allow traders to spot times to enter trades and follow the trend, and ultimately when the trend might be about to reverse.
When setting up a price chart, it can be useful to show moving averages of different time periods. Many traders look to enter or exit positions when a short-term average — for example, the 20-day SMA — intersects a longer-term one, such as the 100-day SMA.
In the Nasdaq 100 Index chart below, it is possible to see points during which the 20-day SMA could have been used to identify trade entry points in an upwards trending market.
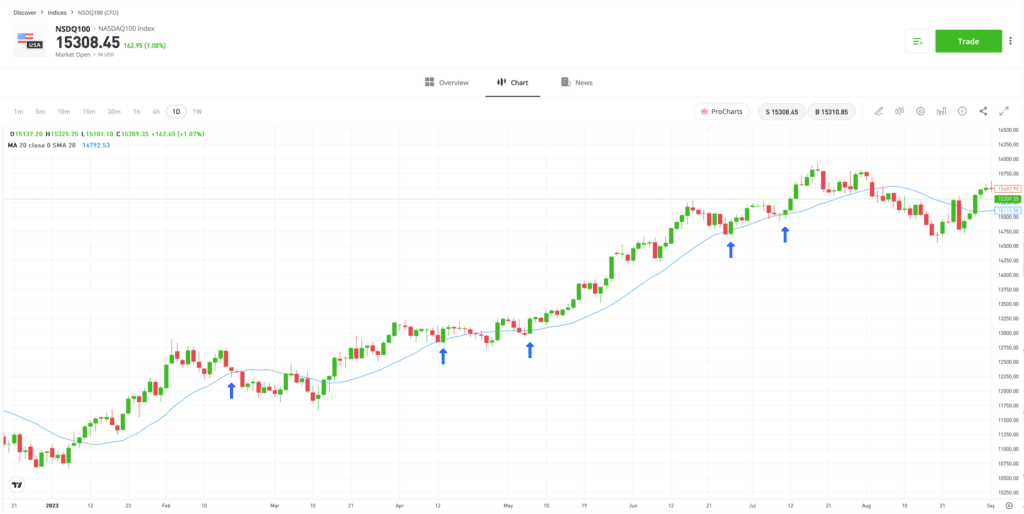
Past performance is not an indication of future results
Source: eToro
Final thoughts
When using technical indicators, context is everything. The first step should always be to establish whether a market is ranging or trending, as this will influence your decision on which indicators to use.
It is also important to use a number of different indicators when considering executing a trade. The greater the number of aligning signals, the more confident you can be in your decision.
Visit the eToro Academy to learn more about technical indicators and charting.
Quiz
FAQs
- Which technical indicators are most commonly used?
-
Simple moving averages are often referred to in analysis and news reports. SMAs are used by those interested in fundamental analysis who might be looking to fine-tune a trade entry point, as well as traders solely using a technical analysis approach.
SMAs offer a clearer view on market conditions as they remove some of the distraction created by short-term price volatility. The 200-day SMA is one of the most keenly monitored technical indicators and is widely used by stock market traders and investors.
- What is the Average True Range?
-
Average True Range (ATR) is a technical indicator that gives an insight into price volatility levels in a market. It is often used in conjunction with indicators that indicate the likelihood of a price reversal, because the ATR can enable traders to speculate on how far a price might move, not just whether it will.
- Is it possible to use too many trade indicators at the same time?
-
Yes, while the golden rule of technical analysis is to use a combination of indicators, it is possible to use too many and cloud your analysis. The trick is to understand which are best suited to current market conditions and to practice using them on a demo account with virtual funds.
This information is for educational purposes only and should not be taken as investment advice, personal recommendation, or an offer of, or solicitation to, buy or sell any financial instruments.
This material has been prepared without regard to any particular investment objectives or financial situation and has not been prepared in accordance with the legal and regulatory requirements to promote independent research. Not all of the financial instruments and services referred to are offered by eToro and any references to past performance of a financial instrument, index, or a packaged investment product are not, and should not be taken as, a reliable indicator of future results.
eToro makes no representation and assumes no liability as to the accuracy or completeness of the content of this guide. Make sure you understand the risks involved in trading before committing any capital. Never risk more than you are prepared to lose.