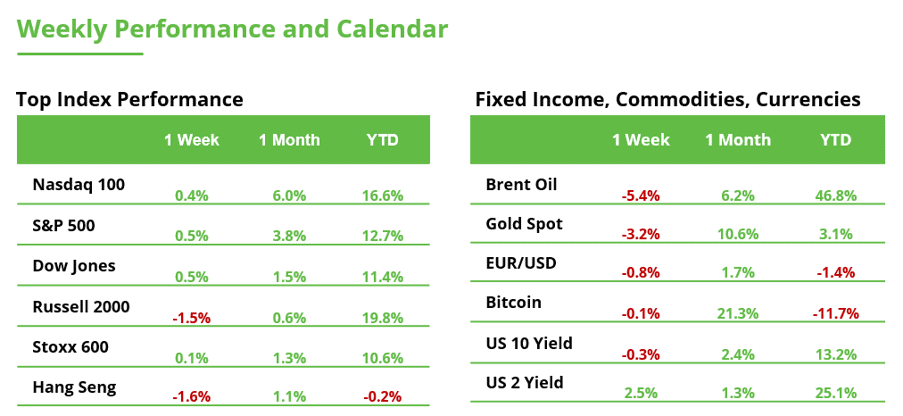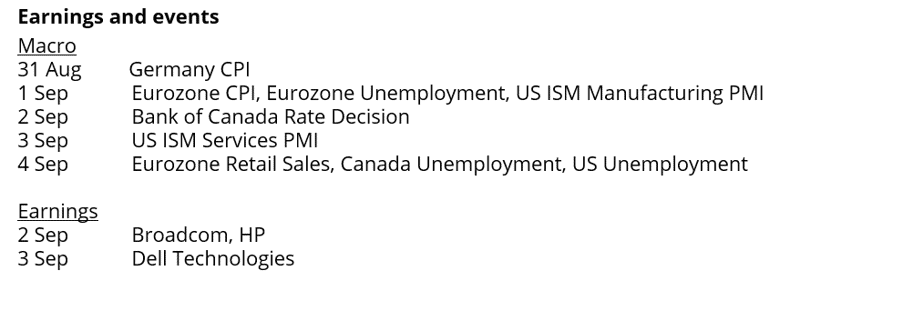



Rather than relying on one superstar stock or theme, the FTSE has had several engines helping to push it towards the 11,000 mark.
For years, the FTSE 100’s lack of big technology names was seen as a weakness. Now, its very different mix of companies is helping it stand out. As investors look beyond the US technology giants that have dominated markets, the FTSE’s heavyweights in banking (making up 19% of the index), mining and energy (19%), and defence (8%) have found themselves in favour.
Several of those forces have come together at the same time. Strong metals prices have boosted miners, relatively high interest rates have supported bank profitability, and rising defence spending has lifted the outlook for the sector. Energy has also contributed at different points.
This makes the UK market an interesting counterweight to the S&P 500. The FTSE has far less exposure to technology and much more to financials, resources and energy. So, when market leadership broadens beyond US tech, the FTSE can perform for entirely different reasons. This can be useful for investors whose portfolios have become increasingly dependent on the fortunes of a relatively small group of large US technology companies.
A UK index with global reach
The FTSE 100 may be Britain’s headline index, but many of its biggest companies are global businesses that generate a large share of their revenues overseas. That gives investors exposure to both the UK and some of the major themes playing out across the global economy.
Global growth, commodity prices, currencies and international interest rates can all have a major influence on its performance. A UK-listed miner, for example, can benefit from rising metals demand around the world, while banks, energy companies and industrial businesses have exposure to markets well beyond Britain.
That global reach is another reason the FTSE can play a useful role in a diversified portfolio. Its move towards 11,000 reflects renewed interest in UK equities, while its international businesses also give investors access to global trends through a market that looks very different from the US.
Investors are buying Britain, but staying cautious
UK retail investors are rebuilding their exposure without betting the house on Britain. Our latest Retail Investor Beat found that 49.1% now hold UK-listed equities, up from 44.0% a year ago. Yet only 29.1% think the UK will be among the strongest-performing markets over the long term, down from 33.0% last year.
So, ownership is rising, but expectations remain measured. It suggests investors are rediscovering the UK market without getting carried away by its recent performance.
Have you missed the boat at 11,000?
For investors wondering whether the boat has already sailed, 11,000 itself should not be the deciding factor. A record index level is not the same thing as an expensive market. The FTSE trades at around 13x forward earnings, compared with roughly 21x for the S&P 500, so reaching a record does not automatically mean UK shares are richly valued.
History also shows that all-time highs are a normal part of rising stock markets, rather than an automatic warning that a correction is around the corner. Investors who wait for markets to stop setting records can risk spending a long time on the sidelines.
What matters from here is whether company earnings keep growing, valuations remain reasonable and the rally continues to spread across sectors. The FTSE reaching 11,000 would certainly be a milestone, but for investors, a new record does not necessarily mean the opportunity has passed.
Nvidia Earnings Recap: Real Debate is Margins
The quarter itself (beat)
- Revenue $96.2B, up 18% Q/Q and 106% Y/Y: beat Street’s $92.1B estimate.
- Data Center revenue of $89.0B (+18% Q/Q, +117% Y/Y) beat Street $87.3B.
- EPS $2.22 vs Street $2.09.
- Returned a record $26B to shareholders (buybacks + dividends).
Guidance (why the stock matters going forward)
- Q3 revenue guided to $108B at midpoint, well above Street’s $104.5B.
- First-ever forward-year framework: management guided FY28 revenue growth of ~70% Y/Y
The one negative: margins
- Gross margin guidance was cut: expected to bottom around 71-72% in fiscal Q4 before recovering to 72-73% in FY28, due to memory (HBM) cost inflation. This is the main reason the stock could see near-term pressure/valuation debate even with a beat.
- The offsetting positive: NVIDIA has already locked in HBM pricing commitments for most of FY28 needs, which puts a “floor” under margins, reducing (not eliminating) the risk that margins keep sliding.
Growth drivers / demand backdrop
- New chip generation (Vera Rubin) started shipping this month with orders already in from major customers, described by management as the fastest product ramp in company history. Prior worries were about a bumpy generational transition; that risk looks reduced.
- Sovereign AI demand grew 35% Q/Q and more than tripled Y/Y, pushing international revenue to 38% of the total. Diversification beyond a few large US customers is a bullish structural point.
- Company is expanding financing arrangements (deals with private capital groups, revenue-share deals with cloud partners) to help customers afford buildouts; this is designed to keep demand flowing even if customers’ own balance sheets are strained.
- “Circular financing” NVIDIA investing in / backstopping the same AI companies that buy its chips is a live debate. Management framed that these investments are proportionate and hedged, but analysts will keep scrutinizing this. This could be a “quality of earnings” concern.
Risks
- Competition from custom AI chips (ASICs) built by hyperscalers themselves, plus AMD, is seen as the main competitive risk over multi-year horizon.
- Memory/component cost inflation an ongoing risk to margin durability, not a one-quarter blip.
Investment Takeaway: this is a “good problem” quarter: demand and revenue guidance came in stronger than expected, but near-term profitability is under some pressure from memory costs. The debate is about (1) how durable the margin trajectory is, and (2) how comfortable investors are with NVIDIA financially propping up parts of its own customer base to keep growth going.
US-Dollar (DXY): Are Sellers Still in Control?
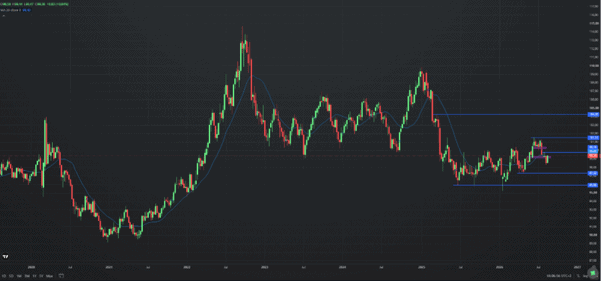
The US Dollar Index gained 0.84% last week to 99.38 points, recovering the previous week’s losses. However, the DXY remains below its 20-week moving average at 99.40 points. From a technical perspective, sellers therefore still have the upper hand in the short term. For around a year, the index has repeatedly moved around this moving average. In the second half of 2025, a bottom formed around the 96-point level. From there, the DXY climbed to 101.50 points in June 2026, its highest level in more than a year. Since then, however, the index has fallen significantly and broken through several support levels (see chart).
For a sustainable recovery, the DXY would first need to reclaim its 20-week moving average and then break above the short-term high at 99.80 points. If it fails to do so, the April low at 97.30 points could come back into focus. A breakout above 99.80 points, however, would improve the technical picture. The first target could then be the yearly high at 101.50 points. Above that, the 104-point area could come into focus.
Nvidia Raises the Bar: Can Broadcom Keep Up?
Markets have already digested Nvidia’s earnings and the Jackson Hole meeting. Now the focus shifts to Broadcom as the AI story enters its next round. Nvidia more than doubled both revenue and profit in the latest second quarter compared with the same period last year. The outlook was even more impressive. Nvidia expects revenue growth of 70% in fiscal 2028. This raises the bar – both for Nvidia itself and for the entire AI sector.
Broadcom now has to show how strong the AI boom remains beyond Nvidia. While Nvidia provides the computing power with its GPUs, Broadcom plays a key role in networking infrastructure and custom AI chips (ASICs). Wednesday’s earnings will therefore be the next important test for the AI infrastructure boom.
Expectations are high. Broadcom has projected that its AI business will exceed $100 billion in 2027. The stock came under pressure following the previous earnings report after management did not raise this forecast. Investors are therefore likely to pay close attention to any new comments on the growth trajectory. Competition is also increasing. Marvell has expanded its partnership with Google, one of Broadcom’s most important customers. Investors will be watching closely to see whether Broadcom can defend its strong position among hyperscalers and continue to benefit from the shift toward custom AI chips.
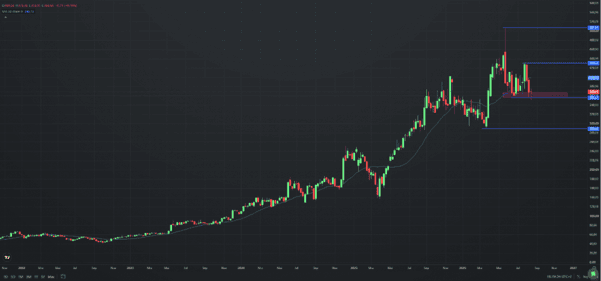
There is also a lot at stake from a technical perspective. Broadcom shares are trading around 27% below their record high of $507 reached in May and closed last week at $369. The first key test is whether the recent move below the $356 low proves to be a false breakdown and whether the stock can subsequently reclaim its 20-week moving average. That would improve the technical picture somewhat.
For a more convincing turnaround, however, the stock would also need to break above the high around $430. If Broadcom falls sustainably below $356 instead, the decline could extend toward the $289 area. This is the most important support level within the longer-term uptrend, which remains intact.
Bitcoin: the easy part is done. Now comes the real test
Bitcoin has moved from around $62,000 to briefly above $81,000, reclaiming important technical and on-chain levels. The improvement is clear. The key question now is whether there is enough real demand to sustain the next leg higher.
Institutional flows have improved materially. Bitcoin ETFs recorded roughly $3.0 billion of net inflows over nine consecutive sessions, but that sequence ended with around $202 million of outflows as macro pressure returned. The message is straightforward: institutional demand is there, but it remains sensitive to rates, the dollar and volatility.
Two levels matter on the downside. The short-term holder cost basis sits near $69,000, while the active realized price is around $75,800. As long as Bitcoin remains above these references, the structure remains constructive.
That makes the $75,800–77,000 area particularly important. A pullback that finds buyers there would strengthen the case that genuine demand is replacing the initial momentum of the rebound. A clear break below would shift attention back toward $68,500–70,000.
Another positive signal is the decline in futures open interest to a five-month low while Bitcoin was rising. Lower leverage leaves the market in a healthier position, but it also confirms that part of the move came from short covering. That fuel is finite. From here, the market needs new buyers.
On the upside, $80,000–83,000 is the decisive zone. It is not only a technical resistance area; it is also where many investors who bought in recent months are approaching breakeven and may choose to reduce exposure.
A sustained break above $83,000, supported by spot buying and renewed ETF inflows, would improve the probability of a move toward $88,000–90,000. Without that confirmation, consolidation between roughly $76,000 and $82,000 remains the more likely outcome.
There is also a broader structural point. Institutionalization is expanding access to Bitcoin and can make normal market flows more stable, but it is also concentrating risk across custodians, derivatives and debt-funded structures.
For altcoins, the margin for error is even smaller. If leverage rises while liquidity weakens, any loss of support in Bitcoin is likely to be amplified across the rest of the crypto market.
The conclusion is simple as bitcoin has improved enough to shift the balance of probabilities, but not enough to confirm a new regime.
The next move must be driven by real demand, not just by short covering.
That is the line separating a strong rebound from a genuine trend change.