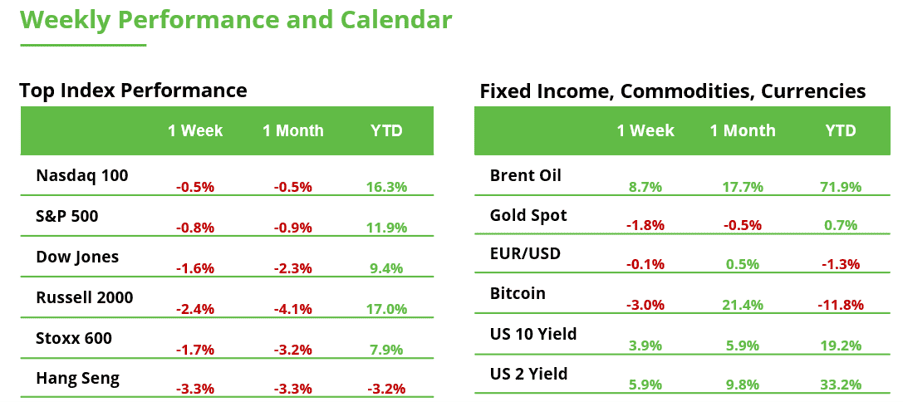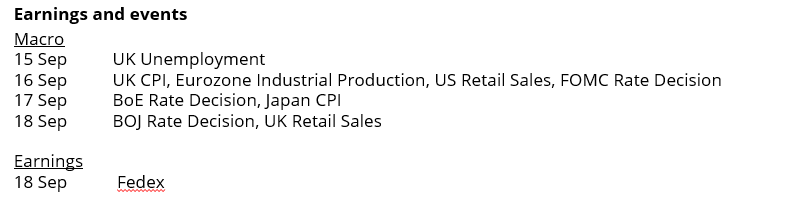



This week’s focus follows an unusual call for restraint from some of AI’s most influential leaders. Anthropic’s Dario Amodei has urged companies to slow the development of their most advanced models, with OpenAI’s Sam Altman and xAI’s Elon Musk backing tighter safety checks. For investors, what matters is whether this shift leads to lower spending. There is little evidence of that so far.
First, leaders are discussing longer reviews, rather than cancelling model training, data centres or chip orders. We think that competition within the US and with China makes an industry-wide slowdown difficult to coordinate.
Nvidia, AMD, Broadcom and other semiconductor stocks may be more volatile because their valuations assume continued growth in demand for computing power. Nasdaq and technology funds could feel the effect because many hold the same companies. However, short-term price pressure would not necessarily signal that the AI investment case is weakening.
Investors should distinguish between a change in sentiment and a change in fundamentals. These comments alone do not justify portfolio adjustments. The outlook would become concerning if Microsoft, Alphabet, Amazon or Meta cut capital spending, semiconductor orders weakened or governments imposed binding limits on model training. Until then, interest rates, valuations and returns from AI spending should remain important drivers of share prices.
Much of the infrastructure spending has already been committed. AI developers still need processors, memory, networking equipment, cooling systems and electricity to train models and serve customers.
A slower release cycle could improve the economics of the AI trade. It would give companies more time to sell products based on existing models and earn revenue from infrastructure already built. Cybersecurity, AI-monitoring software and data-centre power providers could benefit if stricter safety standards require investment.
For retail portfolios, the main issue is concentration. Investors may own the same AI leaders through shares, technology ETFs and US indices without realising how much their exposure overlaps.
Our base case is a temporary rise in volatility rather than an end to the AI investment cycle. Investors do not need to abandon the theme, but those with heavy exposure should review their concentration. Evidence of falling orders or capital expenditure would justify a defensive position. Executive comments alone do not.
The Yen Trade is Getting Serious
Japan’s rate hike is one of the week’s worst-kept secrets. The surprise, if any, will come from what the Bank of Japan says next. A clear hint of another increase by January could keep the yen rally going. A cautious message could encourage traders to take profits, sending the yen lower even as rates rise.
¥150 is where it gets interesting
Markets are no longer treating the yen as a one-way loser. Many institutional investors are betting that USD/JPY falls toward ¥150 to ¥152, while some options target ¥140 as a more extreme outcome. Scott Bessent has also put Washington’s weight behind a stronger yen, raising the risk of betting against it.
We think the speed of the move matters most. A gradual fall toward ¥150 should be manageable. A sudden break below it could force investors to repay cheap yen loans and sell the assets those loans helped fund. That could quickly spread pressure into US technology shares, crypto and emerging markets.
Japanese stocks will split
A rising yen can take a bite out of exporters’ profits. Toyota, Hitachi, ASICS and JFE built their forecasts around a weaker currency, leaving more room for disappointment. Daikin, IHI, Ebara, Yaskawa and Itochu already assume a stronger yen, giving them a larger cushion.
Other sectors could get some relief. Banks can earn more from lending as Japanese rates rise, while utilities pay less for imported fuel when the yen strengthens. Technology and semiconductor shares may wobble if investors initially cut risk. They could recover later if the stronger currency cools inflation and takes some pressure off bond yields.
The yen also changes ETF returns. An unhedged Japanese ETF gives overseas investors exposure to both Japanese shares and the currency. If both rise, the yen adds to the return in dollars, pounds or euros. A currency-hedged ETF removes most of that extra boost.
The effects could create further volatility
A disorderly yen rally could pressure the Nasdaq, Bitcoin and emerging markets as leveraged trades are closed. The effect on US Treasuries and TLT is less clear because risk-off buying could offset selling by Japanese investors.
So what for investors?
For eToro investors, modest yen strength is the base case. The bigger portfolio risk begins if USD/JPY falls quickly below ¥150.
At this point, we view this as a portfolio risk to watch, rather than a reason to suddenly sell everything. Gradual yen strength could favour unhedged Japanese ETFs, banks and utilities, while creating pressure for exporters. It would not, by itself, break the longer-term case for US technology or crypto. Retail investors should focus on concentration and leverage: portfolios heavily exposed to expensive growth assets are more vulnerable if a sharp yen move forces selling across markets. The speed of USD/JPY will tell us whether this remains a currency story or becomes something bigger.
Fed vs. BoE: Two Rate Decisions, One Currency Pair
Several central bank decisions are due this week, with the Fed on Wednesday and the Bank of England on Thursday particularly in focus. For short-term traders, GBP/USD could therefore see particularly high volatility around the two decisions. The Fed is expected to raise rates by 25 basis points to a range of 3.75% to 4%. Friday’s US inflation data pushed the market-implied probability of a hike to around 90%. The BoE, meanwhile, is expected to keep rates unchanged at 3.75%.
Both central banks continue to face inflation risks. Inflation remains above their respective targets, while the rise in oil prices is adding further pressure. Brent futures gained around 9% last week to $105. The further oil prices rise or the longer they remain elevated, the greater the risk of second-round effects and broader price pressures through wages and other prices.
The main differences lie in communication. Fed Chair Kevin Warsh will take questions from the press after the rate decision. The Fed will also publish its new quarterly projections, including the dot plot. The BoE, by contrast, will not hold a press conference, with the next one scheduled for November. Instead, the Monetary Policy Summary and meeting minutes will be published alongside the rate decision. The MPC vote split and any comments on the future path of interest rates are likely to be particularly important.
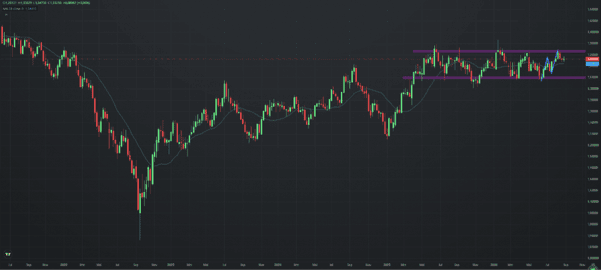
GBP/USD managed to hold above 1.35 last week with a modest gain. This level was already reached in May 2025. Since then, the currency pair has largely traded sideways within a broad range between 1.32 and 1.37. Within this range, however, a pattern of higher highs and higher lows has developed in recent months, giving buyers a slight advantage for now.
The technical picture would improve further with a sustained breakout above the upper boundary at around 1.37. On the downside, the 20-week moving average at around 1.3440 will be important. If GBP/USD falls sustainably below this level, short-term momentum could shift in favor of sellers, making another test of the lower end of the range at around 1.32 more likely.
FedEx: How Resilient Is the Global Economy?
FedEx reports new results on Wednesday and is often seen as a kind of “barometer of the global economy.” Parcel and freight shipments provide early indications of how consumer spending, industry and global trade are developing. Rising B2B volumes can point to stronger industrial demand, while e-commerce and parcel volumes offer clues about the resilience of consumers.
International shipments are also particularly interesting amid tariffs and geopolitical tensions. At the same time, costs are coming into focus. With oil prices above $100, fuel expenses and related surcharges become increasingly important. FedEx therefore brings together several major macro themes – growth, consumption, global trade, inflation and energy.
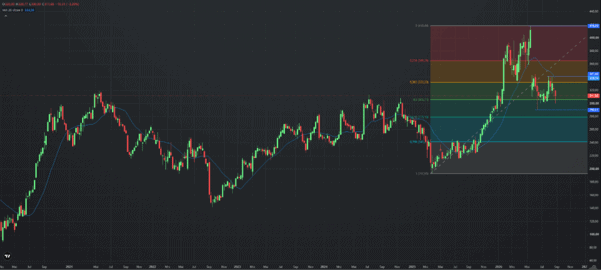
The stock is trading around 26% below its record high of $418, reached in May. It lost 3.2% last week and closed at $311.70. Since mid-June, the stock appears to have stabilized around the 50% retracement of its last major upward move. The upcoming results could provide fresh momentum and help determine whether a sustained recovery is possible or whether the countertrend move deepens further.
For the technical picture to improve, the stock would first need to reclaim its 20-week moving average at around $338 and subsequently break above the August high at $314. It could then move closer to its record high again. If selling pressure continues, another test of the June low at $290 would be possible. Below that, the 61.8% retracement at $279 would become the next important support zone.
The crypto bull case is running out of excuses
Bitcoin has a much stronger structural story than it did a few years ago. There is more regulation, more institutional participation, more products and more infrastructure. But in the short term, the market needs something much simpler: buyers.
Ethereum showed that clearly on Friday. ETH moved from around $2,450 to $2,660, roughly 8.6%, before falling back towards $2,530–2,540. The move is consistent with a reaction to the CPI, short covering and then renewed selling pressure.
During the pullback, around 61,847 ETH, roughly $160 million, were transferred to major trading venues. That does not prove those transfers caused the decline or that the assets were sold. But the timing matters. ETH had enough strength to rally, but not enough to hold the breakout.
Bitcoin now faces a similar test. $75,000 remains the key reference on the downside, while $83,000–85,000 is the area that matters on the upside. As long as $75,000 holds, the recovery remains intact. But to move beyond stabilization, the market would need to see a break of that upper range backed by spot demand, ETF inflows and the ability to stay above resistance.
Liquidity is not giving a clear signal either. Stablecoin capitalization is around $305 billion, but growth over the past week has been limited. The money is there, but that does not automatically mean Bitcoin demand.
The other major variable is the CLARITY Act. The current estimate is a 20% probability that it becomes law before the end of 2026 and an 80% probability that it does not. That 80% does not mean regulatory failure. The split is 20% approval this year, 55% delay with negotiations still alive and 25% a more serious breakdown in the process.
The next key date is September 15. If the vote fails, the important question will not be the headline itself, but whether there is still a credible path for negotiations to continue.
The Bitcoin scenarios remain simple: 25% bullish if BTC breaks $83,000–86,000 with real demand, 45% neutral if it holds $75,000 but continues to struggle at resistance, and 30% bearish if it loses $75,000 and outflows persist. In that case, $60,000–65,000 would come back into view as a stress zone.
The structural story is improving. But markets do not trade on stories alone. They need buyers.