

The race to build a rare earth industry outside China is creating a new group of investable companies.
At first glance, companies like MP Materials ($MP), USA Rare Earth ($USAR), and Rare Earths Americas ($REA) seem to be chasing the same opportunity: reducing Western dependence on China for critical minerals. But investors are actually buying very different business models.
A simple way to think about the sector is to follow the cash and the value chain.
Companies with operating assets, revenue and funding in place are generally lower-risk bets. Companies that need to raise capital to build mines or processing plants may offer bigger upside, but they also face dilution risk if additional funding is required.
Investors should also pay attention to where a company sits in the supply chain. Mining is only one piece of the puzzle. Processing, refining and magnet manufacturing are where much of the industry’s bottleneck sits today. A company that controls more of those steps may have a stronger competitive position than one that simply owns a large deposit.
That is because the industry’s biggest challenge isn’t finding rare earth deposits, but processing them into materials that can be used in magnets, electric vehicles and defence applications.
MP Materials ($MP) is the closest thing the sector has to an established operator. It already owns a producing mine, is building processing capacity, and is expanding into magnet manufacturing. The investment case is more than just digging rare earths out of the ground and more about moving further down the value chain, where margins tend to be higher and competition is lower.
USA Rare Earth ($USAR) is a similar story, but earlier in its journey. Investors are betting that it can build a fully domestic supply chain spanning mining, processing and magnets. That could create significant upside, but it also requires more capital and execution.
Then there are companies like American Rare Earths ($REA) and Rare Element Resources. These are less about current production and more about future potential. Their value depends heavily on whether projects get financed, permits are secured, and processing capacity gets built. In other words, they carry more development risk.
Investors should also remember that the rare earth story extends well beyond the US. Future supply chains are likely to involve mining projects in countries such as Australia, Brazil and Canada, alongside processing and manufacturing hubs elsewhere.
Investment Takeaway: Rare earths may be one of the defining industrial themes of the next decade, but investors shouldn’t treat every stock in the sector the same. Companies with producing assets and existing revenue may offer a steadier way to play the trend, while earlier-stage developers offer higher potential rewards alongside higher financing and execution risk. For investors who believe in the long-term growth of critical minerals but don’t want to pick individual winners, diversified exposure across the supply chain can be another way to access the theme.
Low Vol Strategies: The Market’s Quiet Corner
AI is still the main market story. Semis, mega-cap tech and momentum have carried a lot of the performance, and there are still good reasons investors are paying attention. Earnings growth is real, capex is huge, and the theme has not disappeared.
But when one part of the market dominates for this long, portfolio risk changes. Investors may think they are diversified, but in practice many portfolios are leaning on the same trade: AI, tech, momentum and high beta.
That is why low-volatility strategies are worth another look.
Low vol is not exciting by design. These strategies focus on steadier stocks: companies that tend to move less than the market. In ETF form, that can mean products like SPLV. More broadly, it often means higher exposure to defensive areas such as staples, utilities, REITs and insurers.
The point is not to call the top in AI. The point is balance.
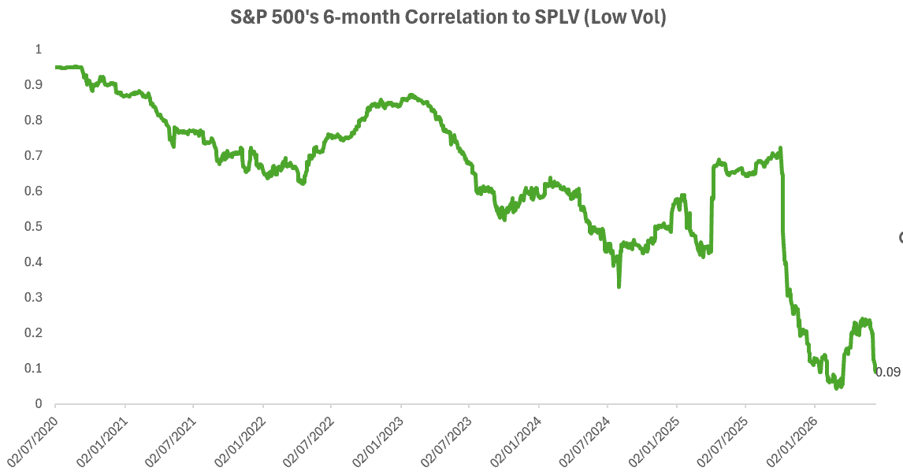
Low vol has been largely ignored, while flows have chased quality and momentum. At the same time, low-vol exposure has become less correlated with the S&P 500. That makes it more interesting as a diversifier.
Investment Takeaway: For retail investors, this is a portfolio construction story. Keep the growth exposure if you believe in it. But after such a strong AI-led run, owning something that does not move in lockstep with that trade may be useful ($SPLV, $Core-Stability). Low vol is not the market’s hottest corner. That is exactly the point.
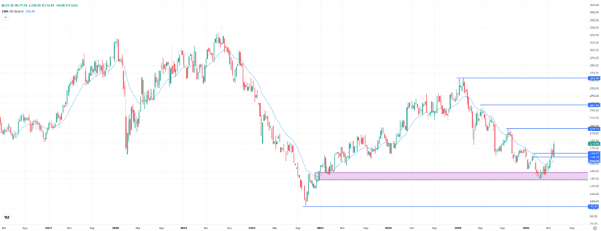
Has Adidas Finally Ended Its Downtrend?
With the ongoing World Cup in North America, Adidas deserves a closer look. Adidas Football chief Sam Handy expects direct additional revenue of more than €1 billion from the 2026 World Cup. Adidas not only supplies the official match ball but also outfits 14 national teams, including Argentina and Spain. That puts the company ahead of rival Nike, which sponsors 12 teams.
In Nike’s home market of North America, Adidas therefore has an opportunity to regain lost market share. The World Cup effect goes far beyond traditional marketing. Adidas is using the tournament to expand its high-margin direct-to-consumer business. While sportswear companies often need to rely on discounts during normal quarters, World Cup demand could allow Adidas to sell many products at full price. Because no margins need to be shared with wholesalers in the DTC business, a potential jersey boom could have a significant impact on operating profits.
Adidas shares rose 9% last week to more than €176. By breaking above the short-term highs between €159 and €164, the stock may have ended a downtrend that had been in place for more than a year. Before the rebound, Adidas had repeatedly posted lower lows. It was only the fair value gap from 2022 between €129 and €138 that halted the decline. From a technical perspective, the lower highs from the previous downtrend are now moving into focus. Potential upside targets stand at €196, €227 and €263. Despite the recent strength, the stock still trades around 47% below its all-time high. On the downside, the breakout zone around €160 and the slightly lower 20-week moving average near €154 could serve as important support levels.
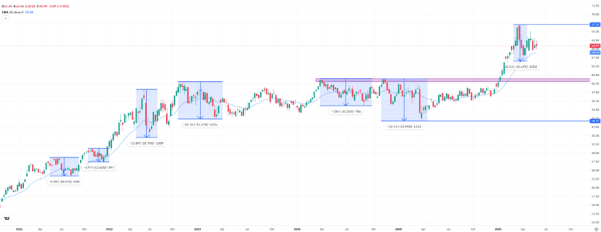
Energy ETF Pulls Back: Trend Reversal or Buying Opportunity?
The iShares US Energy ETF barely moved last week, closing with a modest gain of 0.15% at around $61. The ETF now trades roughly 9% below its record high of $67. Just a few weeks ago, the gap had temporarily widened to around 15%. A look at history shows that pullbacks of 12% to 30% are not unusual in the energy sector. Such corrections have often represented new entry opportunities rather than a lasting trend reversal. This time, the long-term uptrend also remains intact for now.
Should selling pressure increase again, the 20-week moving average around $59 could serve as the first support level. Below that, the recent swing low near $57 would come into focus. If those levels fail to hold, the double-top formation from 2024 around $51 could once again become relevant. From a technical perspective, the long-term trend structure continues to point toward higher highs over the coming months. This outlook would only deteriorate meaningfully if the support levels mentioned above were broken on a sustained basis.
Bitcoin’s $60K Test
BTC continues to trade in a zone that is becoming increasingly attractive from a valuation perspective, but there is still limited evidence that demand has returned.
After briefly falling below $60,000 this week, BTC is trading around $64,000 while facing several headwinds. U.S. spot Bitcoin ETFs have already recorded more than $2 billion in net outflows during June, extending the weakness seen in the previous month. At the same time, on-chain data suggests that the market’s ability to absorb supply has deteriorated significantly. The so-called “apparent demand” metric has contracted by the equivalent of roughly 650,000 BTC, indicating that buying activity remains insufficient to offset selling pressure.
Another important factor is mining economics. The estimated production cost for many publicly listed miners is currently around $71,000 per BTC, meaning that a portion of the industry is operating with compressed margins or below break-even levels.
Macro conditions remain the dominant driver. U.S. inflation has re-emerged as a key concern, and attention is now focused on the Federal Reserve meeting on June 16-17. More than the rate decision itself, markets will be watching for signals regarding inflation, growth, liquidity conditions, and the future path of monetary policy.
From a valuation standpoint, BTC is approaching historically significant levels. Realized Price is currently around $53,000, while BTC is trading close to its 200-week moving average, an area that has historically coincided with major cycle lows.
The caveat is that capitulation metrics remain well below the levels seen during the 2022 bear market. Realized losses have not yet reached comparable extremes, suggesting that the supply-clearing process may still be incomplete.
As a result, the long-term thesis remains largely unchanged, while the short-term outlook continues to depend on three key variables: the Fed’s policy path, the stabilization of ETF flows, and BTC’s ability to hold the $60,000 level.
For long-term investors, the key question is no longer whether BTC is trading in a value zone. The question is when demand will return with enough strength to turn that valuation opportunity into a sustainable uptrend.