

Korea just became the world’s most important stock market, and not in a good way..
Quick gut check
If you own big tech or a chip ETF, you’re now trading based on Seoul’s hangover, not just Wall Street’s mood. The Kospi has become the pre-market tell for AI stocks globally, it’s down ~25-31% from its June peak, and the correlation between Korean stocks and the Nasdaq just hit a multi-year high.
How we got here
Retail investors in Korea went all-in on leveraged ETFs tracking Samsung and SK Hynix: 2x daily bets that needed constant rebalancing. Combined with the two stocks themselves, that trade made up over 70% of all trading volume in Korea’s market. Meanwhile, foreign institutions had already pulled $100B+ out this year.
In other words, retail leverage was keeping up a market that institutions had already started dumping.
What actually happened
Regulators stepped in, hiking minimum deposits for these ETFs 3x and banning new listings, but analysts think it’s a Band-Aid, not a fix. The existing leveraged products are still out there, still rebalancing, still amplifying every move.
Why you should care even if you don’t touch Korean stocks:
- Your chip/AI positions are more correlated than you think. Micron, SanDisk, and the SOX index have all been getting dragged around by Seoul’s overnight action. If you’re holding NVDA, AMD, or a semis ETF, Korea’s close is basically a preview of your next session.
- Leverage cuts both ways, hard. Watching Korea is a live case study in what happens when retail leverage meets a crowded trade. If you’re using 2x/3x single-stock ETFs anywhere, this is the cautionary tale and the unwind can be brutal and fast.
- Don’t confuse volatility with the story being over. The Kospi is still up big for the year. We do not think it signals “AI bubble is bursting” but it may just be leverage getting flushed out of a specific corner of the market. Worth separating the two before you panic-sell your own AI exposure.
Check Korea before you check your portfolio. It’s annoying, but it’s the new rhythm
Big Bank Earnings: Everyone’s Winning, But Not for the Same Reasons
It’s mid-July, which means all 12 major US banks just reported Q2, and the vibe was… really good. Like, “record everything” good. JPMorgan posted 23% ROE. Goldman hit its highest EPS ever ($20.98). Citi had its best quarter in a decade. Still, dig past the confetti and you’ll find some very different stories about why, which is what actually matters for your portfolio.
Banks we looked at: JPMorgan Chase (JPM), Bank of America (BAC), Goldman Sachs (GS), Citigroup (C), Wells Fargo (WFC), BlackRock (BLK), Morgan Stanley (MS), Bank of New York Mellon (BNY), PNC Financial (PNC), M&T Bank (MTB), State Street (STT), and US Bancorp (USB).
The trading desks are printing money
Goldman’s equities revenue: +60% YoY. Citi’s equities: +45%. Morgan Stanley: record $6.3B quarter. Even JPMorgan’s equities business was up a jaw-dropping 86%. The official explanation is a mix of AI-driven capital raising, big IPOs (SpaceX, Alphabet), and wild volatility in Asia.
The unofficial subtext, admitted by basically every CFO on these calls: this is not a repeatable run rate. Citi flat-out told investors to expect markets revenue to drop ~20%+ in the second half, just from normal seasonality, and possibly more this year given how hot Q2 was.
Investment Takeaway: Don’t extrapolate this quarter’s trading numbers into your 2027 EPS model.
AI CapEx is the tide lifting all boats
Every single CEO got asked some version of “is this a bubble?” Morgan Stanley’s Ted Pick gave the most quotable answer: we’re maybe “10% to 15% of the way through” a projected $10 trillion AI compute buildout. Goldman’s Solomon: “early innings,” but “there will be a recalibration… that’s what the path generally looks like.” Translation from every exec, more or less: the money is real right now, but nobody’s pretending this goes up in a straight line forever.
Regular banking is actually the more interesting story
While Wall Street banks lived off trading, the more “boring” regional-ish banks such as PNC, US Bancorp, M&T, Truist-adjacent names, had genuinely strong, durable-looking quarters: broad-based commercial loan growth, improving credit, and dividend hikes across the board (PNC +18%, US Bancorp record deposits, M&T’s best loan growth since 2012). This is the kind of growth that’s less “party trick,” more “the economy is actually fine.”
Investment Takeaways
Three things to actually do with this info:
- Check the mix, not just the headline beat. If a bank’s “beat” is 80% capital-markets/trading revenue (Goldman, Morgan Stanley, Citi), treat the number as more volatile and rate the stock on a lower forward multiple than a bank whose beat came from steady NII and loan growth (PNC, USB, M&T).
- Dividend hikes are a decent “management confidence” signal right now. PNC (+18%), Citi (+12%), Wells Fargo (+11%), State Street (+10%), BNY (+19%) all raised payouts and several (Citi, JPMorgan) are leaning on strong stress-test results to justify it. That’s a real, if boring, tell that balance sheets are healthy.
- Watch credit at the edges, not the averages. Headline charge-offs are low everywhere. But multiple CFOs (JPMorgan, Wells Fargo, PNC) flagged softer underwriting standards specifically in private credit and data-center financing: more PIK interest, looser covenants, more “relationship lending” to unproven data-center operators. That’s the tail risk to watch if the AI buildout stumbles, since banks increasingly finance it indirectly through private credit exposure, not direct data-center loans.
Overall, the “banks are booming” headline is true, but it’s really two separate stories: a Wall Street trading/AI-capex sugar high, and a steadier Main Street lending recovery. Know which one you own.
Not investment advice, just what’s in the transcripts. Do your own homework before trading on earnings season vibes.
Has Wall Street Lost Patience with the Magnificent 7?
The earnings season will be a crucial test for the Magnificent 7, as Wall Street is now demanding results instead of giving them the benefit of the doubt. After years of AI-driven enthusiasm, investors want to see whether the billions being invested will ultimately pay off. This comes at a time when the seven technology giants still account for a significant share of the major U.S. equity indices, yet their performance as a group has unexpectedly lagged behind the broader market this year.
Two Members Report Earnings This Week
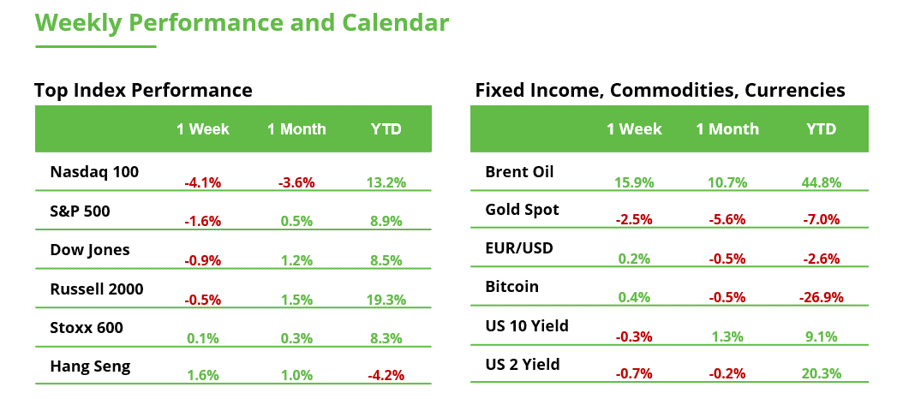
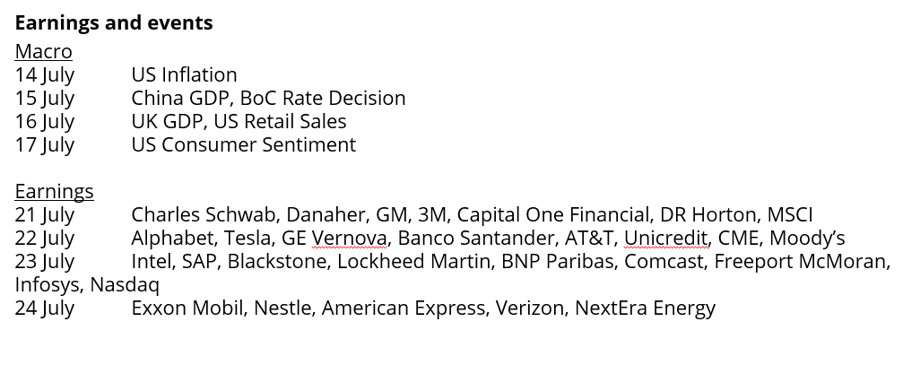
Two heavyweights will take center stage this week. Alphabet and Tesla are both scheduled to report quarterly earnings after the U.S. market closes on Wednesday. The equal-weighted Magnificent 7 ETF has gained just 1.4% year-to-date. By comparison, the S&P 500 is up around 8.9%, while the Nasdaq 100 has gained 13.4%. For investors who specifically backed the major technology companies, that has been a disappointing outcome. At the same time, market breadth continues to improve. Capital is not leaving the equity market but is instead being reallocated within it. Leadership is gradually shifting away from the mega-cap technology stocks toward other parts of the market. Meanwhile, doubts surrounding the AI investment story have increased in recent months. Profit-taking has set in, and investors are becoming increasingly skeptical of the enormous AI spending by the major platform companies.
Alphabet Faces a Key Resistance Level
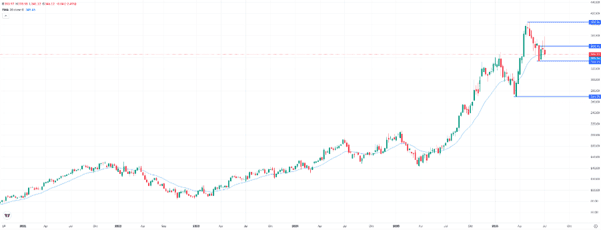
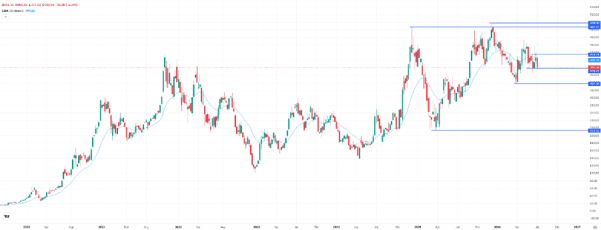
Alphabet shares fell 2.5% last week to $346.10. The stock has now failed for the second consecutive time to break above the short-term resistance level at $360.90. A breakout above that level is needed to extend the current recovery. The record high of $404.40 remains within reach as the long-term uptrend is still intact. However, the stock must first overcome this near-term resistance. Failure to do so could trigger a move below the 20-week moving average and a retest of the June low at $334. Should that support fail, the correction could extend toward the $270 area. The March low at $269.90 remains the key support level for the long-term trend.
Tesla’s Trading Range Is Building Tension
Tesla shares declined 6.6% last week to close at $380.80. From a technical perspective, the chart looks similar to Alphabet’s. The stock has failed twice at the resistance level around $414.60. Following last week’s sharp decline, Tesla also fell below its 20-week moving average and once again tested the June 11 low at $378.10. That support has held for now, resulting in a short-term trading range. Wednesday’s earnings report could now determine the stock’s next major move. A breakout to the upside would represent an important relief signal in the current technical setup. If that fails to materialize, Tesla could retreat toward its April low at $337.20 or even lower.
Bottoming signals are increasing. The recovery, for now, is not.
Bitcoin continues to trade around $64,000, remaining largely confined to the range that has dominated price action since mid-June. At first glance, the market appears to have found some stability: U.S. inflation surprised to the downside, Bitcoin ETFs have returned to posting modest net inflows after eight consecutive weeks of outflows, and investor sentiment is beginning to stabilize. However, the real story is not in the price itself, but in what is happening beneath the surface.
Several on-chain indicators are starting to reach levels that have historically coincided with market bottoming phases. The Realized Profit and Loss Ratio has fallen to its lowest level in 43 months, a situation comparable to the period following the collapse of FTX in late 2022. At the same time, Bitcoin’s MVRV ratio stands at 1.19, within the 20th percentile of its entire history, an area that has traditionally been associated with accumulation rather than overvalued markets.
However, there is one important difference compared with previous cycles: demand has yet to return. According to CryptoQuant data, spot demand has remained negative since December 2025. While it has improved significantly—from approximately -273,000 BTC to around -100,000 BTC in just a few weeks—it still does not confirm the regime change that typically accompanies the beginning of a new bull market.
Adding to this contradiction is another important data point. Long-term holders (LTHs) are realizing losses of roughly $280 million per day, the highest level of capitulation since late 2022. Historically, these episodes have tended to occur close to cycle lows, although on their own they have never been sufficient to confirm a recovery.
Meanwhile, the market remains constrained by a demanding macroeconomic environment. Softer inflation has eased pressure on the Federal Reserve and supported the return of ETF inflows, which have now accumulated more than $51 billion in net inflows since launch. However, long-term interest rates remain elevated, while new sources of risk are beginning to emerge, including a shortage of U.S. dollars in Asia and the growing correlation between the recent correction in semiconductor stocks and digital assets.
Sentiment also reflects this uncertainty. Although momentum has improved somewhat in recent weeks, readings remain around 28 points, firmly within fear territory.
Perhaps the biggest uncertainty facing the market is the divergence between competing narratives. While much of the institutional analysis suggests that Bitcoin may be building a market bottom, another significant group of analysts continues to project a decline toward the $38,000–45,000 range. When two such different interpretations coexist, the most sensible approach is probably not to choose one over the other, but to observe which data ultimately prevails.
As things stand, the data continues to point to a market in transition. Signs of deterioration are beginning to moderate, but the indicators that have historically accompanied the beginning of a more sustained bullish trend have yet to align. Until Bitcoin reclaims technical levels such as $69,900 and $73,300 on a sustained basis, the current environment should be interpreted as one of stabilization rather than confirmation.
Waiting for absolute certainty often means arriving late to the market, but moving ahead before the data supports the case also increases risk.