


Technical analysis tools can help with trade management and can also help you to make informed decisions, manage profits and losses, and approach the markets with a greater degree of discipline. Tools such as
Technical analysis trade management tools can help you to identify the appropriate price levels for buying and selling an asset, while also providing an indication of other factors such as market momentum.
Implementing technical analysis into your trade management will help you to manage your trades as they develop and provide you with additional confidence in your decision to take profits or cut losses.

What is trade management?
Trade management describes your actions or inactions while a trade is active. It covers the period between opening a new trade and closing it out. It can also be described as part of risk management, strategy planning and news monitoring in crypto or stock trading.
Trade planning or management is a crucial part of online trading and investing. It can potentially help you optimize your gains on successful trades and
Tip: When averaging into a position or following a momentum-based strategy, trade management can involve increasing or decreasing position size.
How to use technical analysis as part of trade management
Technical analysis uses historical market data to predict the direction that an asset’s price might take in the future. There are many tools for technical analysis on the market.
Most of these tools work based on mathematical and statistical formulas and can provide insights into whether an asset’s price will continue in a specific direction or if market conditions have changed.
After you have opened a trade, it is possible to use technical analysis to gauge the market sentiment. Key indicators include support and resistance levels, which can help establish the best price level to consider changing your market position.
Technical analysis encompasses charting, patterns and indicators — all of which can be used individually when managing a trade. However, combining the three will potentially produce better results.
For example, in the NASDAQ-100 Index chart below, the points at which the price bounces off the supporting trendline and the absence of any tests of the lower Bollinger Band suggest an ongoing upward momentum. However, a breakout strategy should be applied after the price moves beyond the supporting trendline and trades outside of the lower Bollinger Band range.
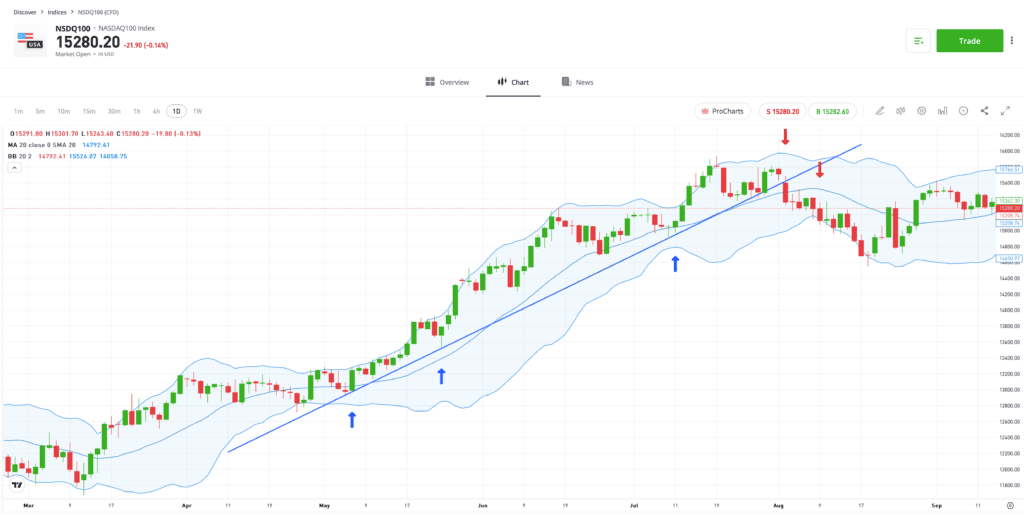
Past performance is not an indication of future results
Source: eToro
How to use technical analysis as part of a trading plan
Technical analysis can offer you guidance at various stages of your trading plan. These include, but are not limited to the following: market analysis, entry and
Market analysis
You can easily establish whether a market is trending or ranging and determine the effectiveness of your trade management strategy.
Tip: If you prefer using range-trading or trending strategies, consider researching different markets to find one that fits your approach.
Trade entry and exit points
Technical indicators can be used to pinpoint price levels at which you want to execute a trade or exit the market. If there is an imminent range of levels in view, there is an opportunity to open or close your positions over a period.
Position size
You can also choose to move up or down on live positions using technical analysis as your guide. However, it is best to have a strategy that makes room for this before opening a trade. That way, your decision will be purely backed by data and not made based on emotions.
Trade volume data
An increase or decrease in trading activity is a sign that the market has changed. There could be more buyers flooding the market or more sellers exiting. Both parties could also be anticipating what might happen next. Depending on your position, a market change could be good or bad.
Nonetheless, the best approach before making a trading decision following a market change is to conduct further research into news events, fundamental analysis and even
Choose your trade monitors wisely
Many traders approach the markets with a natural bias, and the sentiment can be worsened by price movements when a trade is ongoing. If you feel this way when trading, the best approach is to filter what you see. For instance, if you always react to the changing P&L readings on your account while a trade is open, consider removing or hiding the figure, as seen in the example below.
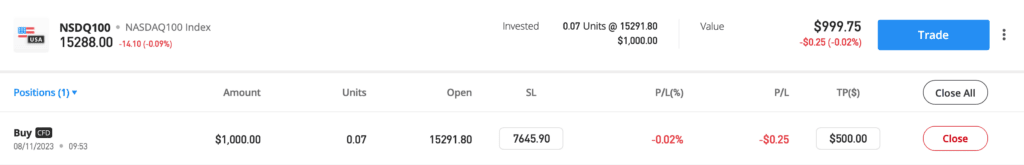
Alternatively, analyze the percentage return field so that you are not tempted to close out winning trades early to “bank” some profits.
Volatility
Price volatility indicators, such as the VIX Index, give an insight into whether other traders expect price moves to become more or less extreme. You can use the data to predict potential price swing strengths, improve your risk management and target new price levels, if necessary.
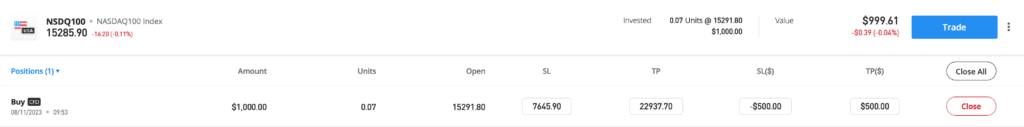
Stop-loss and take-profit
Stop-loss and take-profit orders are particularly useful when managing a live trade with technical analysis. They have various features that can help you manage your trades with discipline and optimize returns.

For context, your stop-loss level for orders determines the maximum amount you are willing to lose on a trade. You can set this before the trade or make adjustments while the trade is still live. You can also leverage trailing stop-loss instructions, which are automated and follow the progress of your winning trades.
Take-profit orders work similarly to stop-losses, but lock in your live profits by closing out some or all of your trading positions at a price you predetermined. With a take-profit order, you can give your trading more structure and reduce the amount of time to get a trade done or manage risks.
Tip: While it can be good practice to move stop-losses to protect profits, widening them on losing trades is discouraged.
Final thoughts
Technical analysis tools provide traders with an effective way to monitor the progress of their trading positions. They help you analyze and interpret different market data in a user-friendly way to get insights into the underlying market conditions.
Also, technical analysis tools put structure into your trading plan, which is a key element when it comes to achieving success and financial freedom.
Visit the eToro Academy to learn more about technical analysis and trade management.
Quiz
FAQ
- What is the difference between trade management and strategy management?
-
Trade management relates to the time during which trades are active, while strategy management can be done at any time. Trade management may involve changing your decision when a live trade is ongoing or post-trade, testing, and research to understand what could have been done better.
- When is the best time to use stop-loss?
-
Deciding whether to do this comes down to personal preference. However, if your trade is showing an unrealized profit and moving away from your entry price, you may consider moving your stop-loss to break even.
- What is the best time to use technical analysis indicators?
-
This will depend on your strategy, but most institutional and retail traders are more active when markets see an increase in trading volumes. The period around the opening and closing of exchanges is usually a popular time to trade as there are more active traders. It is also worth studying the Economic Calendar to identify news announcements that could increase trade flow levels in markets.
This information is for educational purposes only and should not be taken as investment advice, personal recommendation, or an offer of, or solicitation to, buy or sell any financial instruments.
This material has been prepared without regard to any particular investment objectives or financial situation and has not been prepared in accordance with the legal and regulatory requirements to promote independent research. Not all of the financial instruments and services referred to are offered by eToro and any references to past performance of a financial instrument, index, or a packaged investment product are not, and should not be taken as, a reliable indicator of future results.
eToro makes no representation and assumes no liability as to the accuracy or completeness of the content of this guide. Make sure you understand the risks involved in trading before committing any capital. Never risk more than you are prepared to lose.