


Trading strategies and technical indicators help investors make more accurate and informed trading decisions. Technical analysis incorporates charting analysis, price patterns and technical indicators. These approaches can signal future price moves.
Incorporating technical analysis indicators into trading strategies can help traders to identify when a market is ranging, trending or about to reverse. Charting analysis, price patterns and technical indicators can signal future price moves.

How to use technical analysis with trading strategies
Technical analysis is an extensive field that incorporates charting analysis, price patterns and technical indicators. Each approach can signal future price moves. Traders should aim to develop the skills needed to know which indicators are appropriate for the underlying market conditions.
It is important to approach any situation without a natural bias. If you favor going long in a market, you will almost certainly find some indicators that confirm your “gut feeling”. However, a more neutral approach will reveal a greater number of stronger indicators that might point to price moving down, instead of up.
Tip: If you are biased toward going “long” or “short”, consider finding a market that is trending in that direction.
It is also vital to consider market conditions. If price is moving sideways, then range trading strategies would be more effective than trend-following strategies. This can be challenging for traders who prefer one kind of approach to another.
Selecting the right indicators for each strategy
Traders commonly have more confidence in a decision if a number of different indicators and signals point in the same direction. However, there are hundreds to choose from, so it is important to select the best trade indicators and avoid those that might distort your analysis.
Some indicators, such as simple moving averages (SMAs), can act as a guide in both trending and sideways markets. Their simplicity makes them a useful tool in all market conditions.
Bollinger Bands also have the potential to be a reliable guide in both market types. Bollinger Bands can be used to identify changes in price volatility, as well as the range in which price can be expected to trade, making them an ideal option for those trading ranging markets.
Tip: Choosing the indicators to leave out of your analysis is as important as choosing those to leave in.

Examples of strategies with technical analysis
Using a demo account is one of the best ways to develop the skills required to trade a range of different market conditions. This enables you to use advanced analysis tools to learn how to spot the different setups seen in the market and trade them in a risk-free environment.
You can then review your strategy before implementing it using real funds. This will also provide you with an opportunity to understand and follow the natural life cycle of a technical analysis strategy and learn ways to incorporate risk management into your approach.
Trend following strategy
Using technical analysis to identify the optimal time to join a trend can involve using stochastics and oscillators to identify when a trend or trend retracement is about to end. Those peaks and troughs in price show the exact moment that price starts to return to follow the direction of the underlying trend. Oscillator and stochastic indicators work well when used in conjunction with trend lines that mark support and resistance levels.
Trendline break strategy example
Many experienced traders will have heard the expression: “The trend is your friend, until the bend at the end.” Trend line breaks signal a point at which those following the pattern should consider exiting the position. A reversal in buying and selling activity can also trigger a new trend, but one that heads in the opposite direction.
In the example chart shown below of NVIDIA Corp, you can see a downward trend, followed by a trend line break, which led to the formation of a new, positive trend.
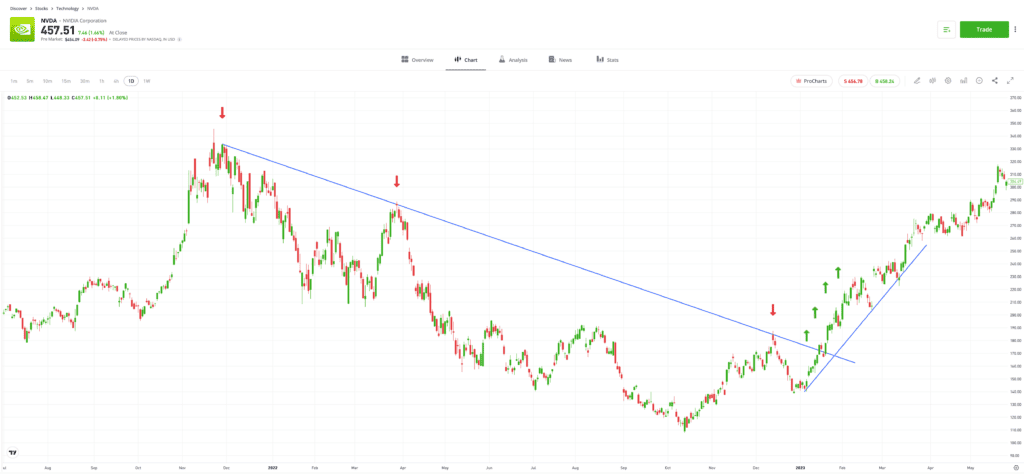
Past performance is not an indication of future results
Source: eToro
Breakout strategy
Breakout strategies look for price movements that signify a change in market conditions. Breakouts can follow periods during which price has been range-bound, or when a trend ends.
Retest long and retest short strategies example
When a breakout occurs, inexperienced investors might be tempted to enter into positions immediately. However, there is often a period following a breakout when price returns to revisit the crucial support/resistance level it has just gone through.
The retest strategy involves showing a degree of patience and waiting for price to return to a better entry level, rather than chasing the price as it makes its first move. Retests form an important part of forex technical analysis strategies, as demonstrated by the example below taken from the EURUSD market.
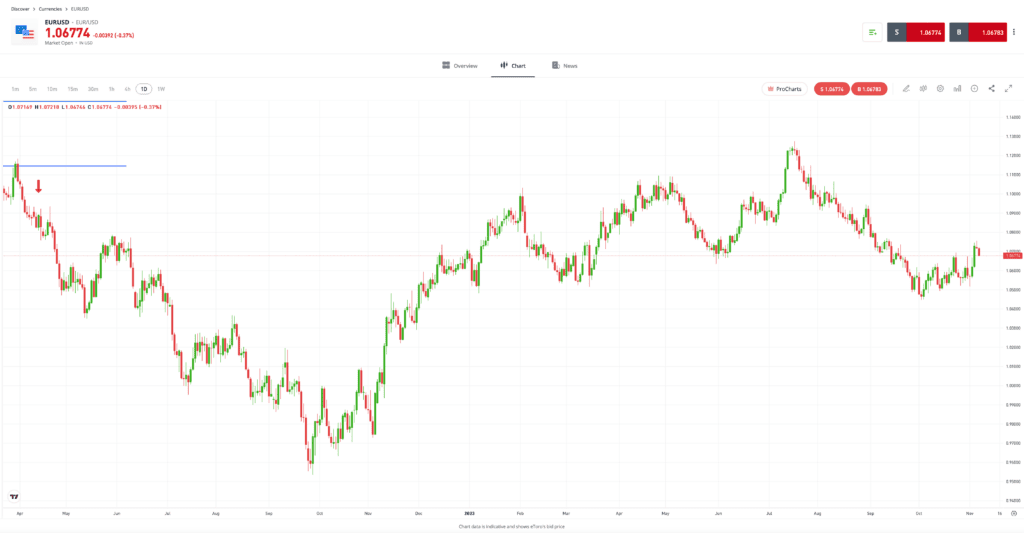
Past performance is not an indication of future results
Source: eToro
Tip: Signals are usually stronger if trading volumes increase at the same time that breakouts, trend line breaks and retests occur.
Why use technical analysis as part of a trading strategy?
The wide range of indicators available, and the way that the approach can be applied to any market, and any time frame, allows some traders to rely solely on trading strategies using technical analysis.
That being said, even buy-and-hold investors using fundamental analysis can possibly benefit from using technical indicators to optimize their trade entry and

Final thoughts
Using technical analysis trading strategies does not guarantee that trades will be successful. Instead, traders should aim to develop the skills that allow them to improve, rather than perfect, their performance. Consider your win-loss ratio, maximum drawdown, or other metrics that allow you to analyze what you are getting right, and wrong.
Visit the eToro Academy to learn more technical analysis and trading strategies.
Quiz
FAQs
- What part of a candlestick should I use when drawing trendlines?
-
This comes down to personal preference. Some traders prefer to use the ends of shadows, which show the highs and lows of a trading session. Others like to use the ends of the real body of a candle which show the opening or closing price.
- What are the weaknesses of technical analysis?
-
Technical analysis uses historical data, so it generates lagging indicators. The approach also fails to incorporate elements of fundamental analysis, such as economic cycles and upcoming news events. Real-world events, which are impossible to identify from a price chart alone, can act as a catalyst for a price move.
- Which markets should I use technical analysis in?
-
Technical analysis strategies can be used to trade the stock, forex, commodity or crypto markets. The underlying principles remain the same, which makes it a popular way of trading various asset classes.
This information is for educational purposes only and should not be taken as investment advice, personal recommendation, or an offer of, or solicitation to, buy or sell any financial instruments.
This material has been prepared without regard to any particular investment objectives or financial situation and has not been prepared in accordance with the legal and regulatory requirements to promote independent research. Not all of the financial instruments and services referred to are offered by eToro and any references to past performance of a financial instrument, index, or a packaged investment product are not, and should not be taken as, a reliable indicator of future results.
eToro makes no representation and assumes no liability as to the accuracy or completeness of the content of this guide. Make sure you understand the risks involved in trading before committing any capital. Never risk more than you are prepared to lose.