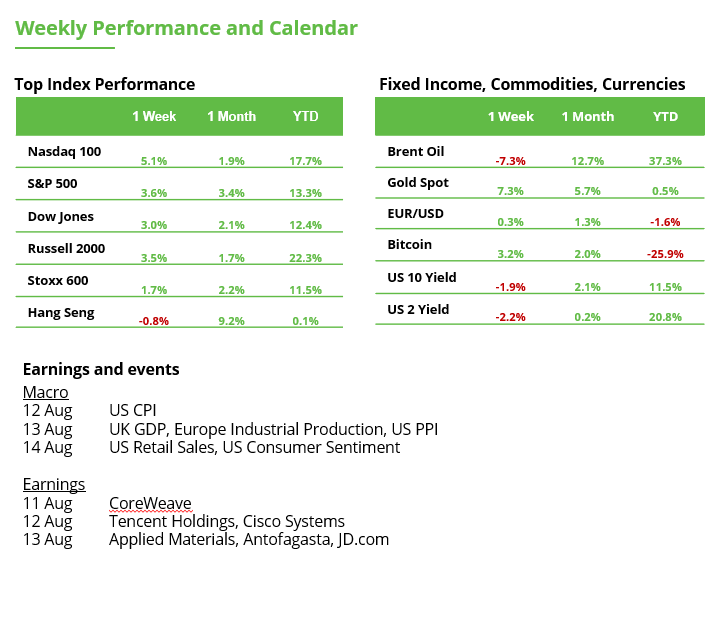



CoreWeave, Applied Materials and Cisco Face the Earnings Test
This week’s earnings from CoreWeave, Applied Materials and Cisco will offer three different views of the AI investment boom. AI spending remains enormous, but markets are becoming more demanding about who can turn it into sustainable profits. CoreWeave will test the economics of building AI computing capacity, Applied Materials the demand for increasingly sophisticated chipmaking equipment, and Cisco whether AI spending is spreading into networking. Together, their results can show where the financial rewards, and risks, of the next stage of the AI buildout are starting to sit.
CoreWeave may provide the sharpest test of the AI spending boom this week. Its nearly $100 billion backlog suggests demand remains strong, but converting that demand into profits requires enormous spending on data centres.
For investors, the focus should therefore be on whether new capacity is coming online on schedule, profit margins are improving and financing costs remain manageable.
CoreWeave is also expanding beyond renting GPUs into software and services, which could improve profitability over time. The main risk is that rising AI computing capacity pushes GPU rental prices lower, making it harder to earn attractive returns on today’s heavy investment.
Applied Materials earnings will test whether increasingly complex AI chips are translating into faster profit growth.
Investors should watch three areas: high-bandwidth memory, advanced packaging and management’s outlook for chipmaker spending. Industry investment is expected to remain strong into 2027 as memory and leading-edge chip capacity expands.
Still, the stock has already priced in significant growth. A positive earnings signal would be stronger orders and guidance, particularly from memory customers, showing profits can keep rising with AI investment.
Finally, Cisco’s earnings will test whether the AI boom is turning into meaningful revenue beyond chips. AI-related networking orders have surged as large cloud companies build bigger data centres, and recent wins should begin contributing more to sales over the coming quarters.
Investors should watch whether networking growth and new orders remain strong, particularly in optical products used to connect AI systems. The other test is profitability: higher component costs could limit how much of that growth reaches the bottom line.
Strong guidance for 2027 would strengthen the investment case, particularly if AI growth is accompanied by continued demand from Cisco’s traditional corporate networking customers.
The Great Copper Squeeze
Copper has surged above $14,000 a tonne to record highs, extending a rally that increasingly reflects a scramble for available metal rather than booming global demand. The interesting part for investors is what is driving the move. This is increasingly a story about where the world’s available copper is sitting, rather than booming global demand.
Copper market is developing into a US-China tug of war.
US inventories have surged as traders move metal into the country ahead of a potential tariff on refined copper. At the same time, Chinese copper smelters are having difficulty getting enough of the raw materials they need to produce refined copper. Data show that LME inventories have fallen more than 40% since May, while the premium for immediate delivery has climbed sharply, both signs that copper available outside the US is becoming increasingly scarce. Some industry analysts believe that this btightening in supply could push copper towards $15,000 a tonne.
For equity investors, miners offer a way to participate if copper remains elevated, with direct plays on copper such as Freeport-McMoRan in North America, and Antofagasta in Europe, alongside diversified exposures such as BHP and Rio Tinto.
There is an important catch. Copper has already risen substantially, so tariff policy could now determine the next move. A US tariff could intensify stockpiling and push prices higher, benefiting copper-sensitive miners mentioned above. Conversely, a decision against tariffs could release some US-bound metal back into the global market and unwind part of the squeeze.
For retail investors, that makes copper miners attractive selectively rather than indiscriminately. Production growth, costs and balance-sheet strength matter when much of the commodity’s next move depends on Washington.
Copper: False Breakout or Just a Pause?
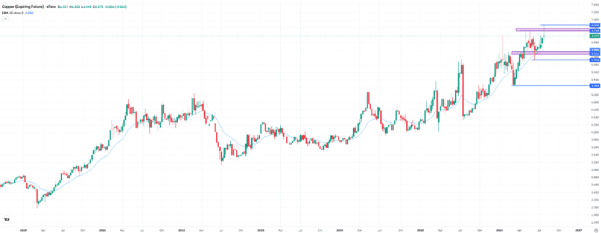
Copper climbed as high as $6,858 last week, marking a new record high. Toward the end of the week, however, short-term profit-taking set in. The metal finished the week at $6,575, still posting a weekly gain of 0.9%. From a technical perspective, the move above the May high of $6,711 initially turned out to be a false breakout. While the rally has lost some momentum, the broader uptrend remains intact. Another breakout attempt and the potential for fresh record highs therefore still appear likely. If selling pressure increases, the first key support comes in around $6,145. This level has been successfully defended several times since May, with copper never closing below it on a weekly basis. Slightly above that, the 20-week moving average is currently located at $6,202. If these support levels fail to hold, the correction could extend toward the June low at $5,922 or even lower.
CoreWeave: Is a Trend Reversal Finally Taking Shape?
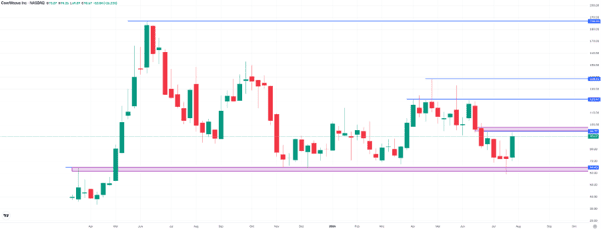
CoreWeave shares gained 26% last week to $90.70, reducing the decline from the 2025 record high of $186.60 to around 52%. The long-term support zone at $64.40 was successfully defended last week, allowing the stock to stabilize. For the chart picture to improve further, however, the stock needs to break above its short-term resistance levels. The first key hurdle stands at $94.80, which is now within reach following the recent rebound. The crucial question is whether the stock can achieve a sustained breakout on a closing-price basis. If successful, the path would open toward the next major resistance around $121.50, an area where several false breakouts have occurred in the past. Above that, the May high above $138 comes back into focus. If the stock fails again around $94.80 or cannot establish a sustained breakout, selling pressure is likely to return. In that case, another test of the long-term support at US$64.40 becomes increasingly likely.
Strong hands accumulate, but weak hands are still selling
Bitcoin remains around $65,000 at a particularly significant moment, as the data show that large buyers are accumulating, but the market is still not responding with the strength one might expect.
On the one hand, on-chain signals are reasonably constructive. Whale holdings are estimated to have increased from 2.87 million to 3.06 million BTC so far this year, while $63,000 is consolidating as an important reference level. That level practically coincides with the 200-week moving average, currently around $63,700. In addition, funding shows no signs of excess, pointing to purchases being made primarily through spot markets rather than leverage.
But there is another side to the picture. More bitcoin is still being sold than the market is able to absorb, with a recent imbalance of close to 147,000 BTC. In other words, although significant buyers are returning, buying pressure is still not strong enough to clearly outweigh selling pressure, with retail activity remaining at historically low levels and momentum still weak.
Bitcoin ETFs recorded a positive week with close to $870 million in inflows, the strongest figure since April, with IBIT accounting for around 80% of the total. In bitcoin terms, this would represent purchases of nearly 10,000 BTC per week. Added to this is Strategy, which continues to emerge as one of the major structural buyers.
However, bitcoin is barely moving, and the takeaway is not that buyers are absent, because they are there. The issue is that there is still enough selling pressure to absorb a large part of that demand and prevent accumulation from translating into a clear price breakout. To speak of a change in trend, that balance would need to start shifting more consistently toward demand.
Moreover, the macro backdrop does little to simplify the picture. The yield on the 30-year U.S. Treasury has risen above 5.2%, introducing competition for capital that is particularly relevant for risk assets. At the same time, a weaker dollar and a subdued MOVE Index are improving liquidity conditions. The U.S. CPI release on August 12 could be the next inflection point.
Against this backdrop, bitcoin appears to be building a base rather than initiating a breakout. Whales are accumulating, ETF inflows are returning, leverage shows no signs of excess, and $63,000 provides a clear reference level. But there is also still enough selling pressure to keep the price contained.
The truly important signal will come when we know whether buyers ultimately absorb that supply or whether, on the contrary, sellers regain the upper hand.