


FX traders are getting a reminder that sometimes getting paid to wait can matter more than picking the next big currency comeback.
Currencies backed by higher interest rates have been among the stronger performers, helped by relatively calm markets and decent global growth. For FX traders, that interest-rate gap can itself become part of the trade. Buying a higher-rate currency against a lower-rate one can come with an overnight financing benefit (although on CFDs the actual fee or refund depends on the currency pair and can change over time).
That has kept currencies including the Mexican peso, Australian dollar and Norwegian krone on traders’ radar, particularly against lower-yielding alternatives such as the Swiss franc.
The flip side? Cheap doesn’t automatically mean ready to rebound. The Japanese yen remains historically inexpensive by some measures, but Japan’s interest rates are still well below US levels. That gap can make betting on a sustained yen recovery difficult while US rates stay elevated. EUR, CAD and NZD face a similar, if less extreme, challenge: improving economic momentum has yet to overcome their yield disadvantage.
For retail FX traders, this creates several pairs to watch. USD/JPY remains sensitive to the US-Japan rate gap, while AUD/CHF and NOK/CHF can reflect the contest between higher-yielding cyclical currencies and lower-yielding funding currencies. EUR/USD remains closely tied to expectations for US rates.
The potential plot twist is the Fed. A decisive shift toward rate cuts could compress yield gaps, weaken carry trades and give currencies such as the yen a better chance of recovering. Until then, interest-rate differentials may remain one of FX’s biggest forces.
AI Software Reset
The investment case for software is becoming more interesting as AI disruption fears collide with much lower valuations.
The distinction investors should make is between software that is relatively easy to replace and platforms that hold critical company data, manage workflows or act as systems of record. AI can make building applications cheaper, but replacing established enterprise platforms involves integration, security, maintenance and reliability. Microsoft, ServiceNow and Salesforce therefore look better protected than the broad “AI kills software” narrative suggests.
Microsoft offers perhaps the most balanced exposure. Azure benefits from rising AI infrastructure demand, while Copilot and its enterprise applications provide opportunities to turn AI usage into recurring revenue. ServiceNow offers a more contrarian opportunity. Its position in enterprise workflows could make it an important platform for deploying AI agents, while depressed expectations leave scope for a rerating if growth improves. Salesforce offers a similar recovery proposition if AI monetisation offsets pressure on traditional seat-based subscriptions.
For investors seeking stronger growth, Datadog and Snowflake provide exposure to the infrastructure surrounding AI applications. More AI workloads should mean greater demand for monitoring, data management and consumption-based services, although their higher valuations leave less room for disappointment.
The main catalyst to watch is revenue growth. Investors should look for software growth stabilising, AI products becoming meaningful revenue contributors and gross margins improving as inference costs decline. If these arrive together, the sector could benefit from both stronger earnings expectations and higher valuations.
The opportunity is therefore selective rather than a broad bet on software: favour businesses where AI increases the value or usage of an already deeply embedded platform.
South Korea Set for a Comeback: Is the Correction Over?
The iShares MSCI South Korea ETF gained 8.2% last week to $179.70, marking its second consecutive weekly gain. Since its July low, the ETF has already recovered by around 26%. However, there is still plenty of ground to make up. From its record high of around $221 in June, the ETF had fallen by roughly 35%. From a technical perspective, signs of stabilization are increasing. Two moves below support at $154 turned out to be false breakouts. The ETF subsequently moved above recent short-term highs and reclaimed its 20-week moving average.
As long as these levels hold and the long-term uptrend remains intact, the record high could come back into focus in the coming weeks or months. A breakout above that level would open the door to further upside. However, if the ETF falls sustainably below the support levels mentioned above, the low from three weeks ago at $142.60 could come back into focus. Below that, the correction could extend toward the $115 area. For now, however, this is not the base case.
Walmart: Narrowly Escaped a Bear Market?
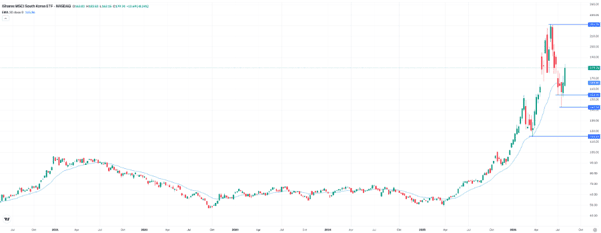
Walmart shares gained 3.1% last week to $115.30, extending their recovery. It was the third consecutive weekly gain, with the stock now up around 8% from its July low. The long-term uptrend remains intact, but the short-term technical picture is still under pressure. After reaching a record high of $135.10 and posting two false breakouts above the previous all-time high from February, the stock came under significant pressure. At its lowest point, it fell around 21%, briefly entering bear market territory.
The false downside breakout at $107.20 four weeks ago and the subsequent recovery provide some encouragement. However, buyers still need to overcome several hurdles for the technical picture to improve sustainably. The first challenge is to reclaim the 20-week moving average. Above that, further key resistance levels lie around $118 and $123. As long as these levels are not sustainably broken, the risk of another pullback remains high. If sellers manage to push the stock to a new lower low, the next stronger support can be found around $98.
Thursday’s earnings could provide the decisive catalyst, determining whether Walmart extends its recovery or sellers regain control.
Is Bitcoin preparing for its next big move?
BTC is trading around $63,000 after losing $65,000. This time, price weakness is accompanied by weak flows. Spot ETFs have posted roughly $385 million of net outflows this week, reversing part of the $853 million that flowed in the previous week. Unlike some prior corrections, price and institutional flow proxy (ETFs) are now pointing in the same direction.
Volatility is compressed to extreme levels. 30‑day realized volatility is around 22.1% annualized, approximately the 1.1th percentile of the last year, while implied volatility sits near 23%. This does not tell us the direction of the next move, but it does suggest the market is unlikely to stay in this state for long.
Key levels matter: $62,500 is the first reference. Below that, the liquidation map shows clusters near $61,000, so a break of support could accelerate moves toward that zone. Above, reclaiming $65,500 with volume and improved ETF flows would materially change the tactical picture.
For now, we see no reason to increase risk. Caution, no leverage, and wait for confirmation. The signal would not be just a price bounce, but evidence of returning demand: several days of stabilization and/or sustained ETF inflows alongside a recovery above $65,500.
That said, short‑term weakness should not be confused with an equivalent deterioration in the structural thesis.
While Bitcoin remains stuck around $63,000, large asset managers continue to build crypto infrastructure with a multi‑year horizon. This is one of the most interesting divergences right now: price is still digesting the bearish cycle, while institutional infrastructure keeps being built.
Behind this lies an even bigger trend: tokenization. On‑chain assets remain small relative to traditional finance, with roughly $300 billion on‑chain versus a global equity market of around $120 trillion. Even a partial migration would completely reshape the scale of the ecosystem.
Ethereum deserves a separate read. With ETH around $1,890 and a record near 35% of supply in staking, the debate is no longer only how much capital Ethereum can attract, but how much value from that activity accrues to ETH.
Proposals such as EIP‑8363 aim to reduce issuance for security that is no longer needed, implying lower dilution and a potentially more favorable monetary policy for ETH. The trade‑off is ensuring that greater scarcity does not compromise the decentralization it seeks to protect.
This aligns with a fundamental long‑term question for Ethereum: it remains a leading candidate to capture growth in stablecoins and tokenized assets, but it still needs to demonstrate how that activity translates into value for ETH. That variable likely deserves more attention than any price target.
Short‑term takeaway: the market has not yet given a clear signal of a bottom, with $62,500–$61,000 as the first zone that could decide BTC’s next move. Long‑term, however, institutionalization, tokenization, and the migration of financial assets on‑chain continue to advance.
You do not need to call the exact low to participate in that trend. You do need to avoid leverage and short‑term noise that could push you out before the thesis has time to play out.