


Tech was the standout leader in the stock market in Q2. The Daily Breakdown takes a look at the blazing rally to record highs – and where bulls want to see support.
Before we dive in, let’s make sure you’re set to receive The Daily Breakdown each morning. To keep getting our daily insights, all you need to do is log in to your eToro account.
Thursday’s TLDR
- Tech leads market gains
- The QQQ breaks out
- Nike jumps, BABA slumps
What’s Happening?
We already know tech was the best-performing sector from Q2 and recently, the momentum was enough to fuel the group to record highs. Tech has the highest expected earnings growth for 2025 and with its current weighting, makes up roughly one-third of the S&P 500.
When we look under the hood though, some interesting questions come to light. Things like:
- Semiconductor stocks like Nvidia and Broadcom have led the charge. Can semis continue higher after a bumpy first half?
- As for the Magnificent 7, Nvidia and Microsoft were the only two components to make new record highs in the quarter. Can others — like Tesla, Apple, and Alphabet — join them in the second half?
- Can tech, with its outsized weighting on US stock indices, provide stability to the overall markets and help fuel a further rally in the second half?
For Today: Tech won’t be the talking today. Instead, that belongs to the jobs report.
Wednesday’s ADP report showed a surprise decline in hiring. Today’s expectation calls for roughly 110K jobs to be added to the economy, with a slight uptick in the unemployment rate to 4.3%.
Reminder: The US stock market closes early today, at 1 p.m. ET, and is closed completely on Friday.
Want to receive these insights straight to your inbox?
The Setup — The QQQ ETF
Last week’s rally was enough to send the QQQ ETF to new all-time highs, breaking out over the key $535 to $540 zone.
This area was resistance in December and February, and bulls would like to see this zone act as support on future pullbacks. From the current highs, that would be a decline of roughly 2% to 3%.
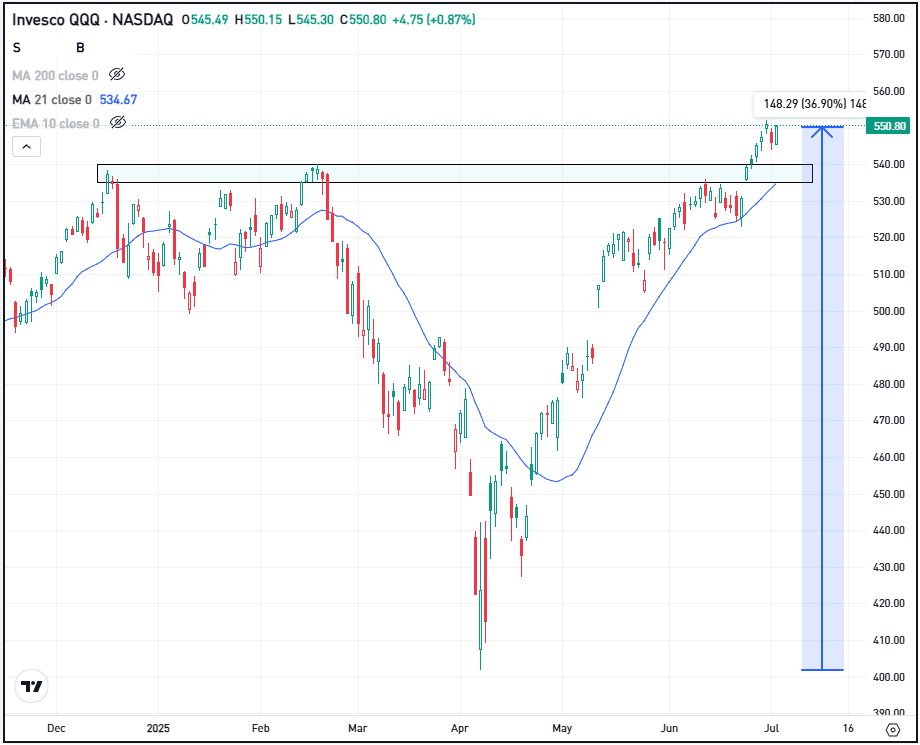
If support holds, bulls can maintain momentum and remain in control of the current trend. However, if this potential support area fails, then we could be looking at more downside pressure in the short term.
If support fails, it doesn’t mean the trend will suddenly reverse and markets will crash. But it could mark a short-term direction change while bulls look for a bigger support level.
For now the trend remains strong and intact, but let’s keep an eye on the $535 to $540 zone.
Options
For options traders, calls or bull call spreads could be one way to speculate on support holding on a pullback. In this scenario, options buyers limit their risk to the price paid for the calls or call spreads, while trying to capitalize on a bounce in the stock.
Conversely, investors who expect support to fail could speculate with puts or put spreads.
For those looking to learn more about options, consider visiting the eToro Academy.
What Wall Street Is Watching
Shares of Alibaba dipped yesterday and are down again in pre-market trading, presumably lower this morning on the back of a proposed $1.53 billion bond offering. The stock has been in a bit of a funk. Despite climbing more than 70% at one point this year, BABA stock has lost about 25% of its value from the recent highs. Check out the chart for BABA.
Nike has been riding a wave of momentum since reporting earnings last week. Shares climbed over 15% last Friday and were slowly inching higher this week until yesterday’s 4% jump. The stock climbed on optimism over a US trade deal with Vietnam.
Disclaimer:
Please note that due to market volatility, some of the prices may have already been reached and scenarios played out.