

For years, the gold market seemed easy to explain. Central banks bought, geopolitical tensions rose, and prices climbed. That relationship has become much less straightforward. Data suggest that the balance of power inside the gold market has shifted, with several less obvious changes that could matter for investors over the next year.
Here are four developments worth watching.
- Gold has become much more sensitive to real yields than it was before
Gold’s relationship with real bond yields has strengthened sharply this year. Gold is now falling much faster for each increase in real Treasury yields than it did before 2022.
Investment takeaway: Gold may become increasingly volatile around inflation reports, payrolls and Federal Reserve meetings. Investors who own gold should pay as much attention to macroeconomic data as they do to geopolitical headlines.
- ETF investors are back in the driver’s seat
Global gold ETFs have seen around 128 tonnes of net outflows since late February, roughly 3% of total holdings. At the same time, demand from several other buyers has slowed, giving ETF investors much greater influence over short-term price movements than they had during the previous rally.
Investment takeaway: Watch ETF flows alongside the gold price. Sustained inflows could become an early signal that investor sentiment is turning before the price itself breaks higher.
- Central Banks have not disappeared
Many investors assume gold has weakened because official buyers have stepped away.
That is only partly true.
Central banks are still expected to buy around 600 tonnes of gold this year. That is lower than previous expectations of 640 tonnes, but it remains historically strong. The bigger slowdown has come elsewhere. Expected growth in global bar and coin demand has been cut from 10% to just 3.6%.
Investment takeaway: Long-term demand has softened but has not collapsed. If retail buying, ETF inflows or central bank purchases begin strengthening together again, gold’s longer-term bull case could quickly regain momentum.
- Investors are chasing AI instead
We think that gold and AI may increasingly compete for investor attention. Investors have shifted their attention towards high-growth themes leaving precious metals competing for capital against one of the market’s strongest-performing sectors. If enthusiasm for technology begins to cool or valuations become harder to justify, some capital could rotate back into defensive assets such as precious metals.
Investment Takeaway:
Gold’s outlook for the second half of 2026 looks less like a straight-line rally and more like a waiting game. Instead of treating every geopolitical headline as a buying signal, investors may want to focus on whether the macro backdrop is becoming more supportive. Signs that real yields are easing, ETF inflows are returning and Fed expectations are becoming less hawkish could provide a stronger foundation for gold than headlines alone.
For long-term investors, the second half of 2026 may be less about chasing momentum and more about watching for evidence that these underlying drivers are beginning to turn.
Is the Dollar‘s Comeback Already Underway?
For much of the past two years, one of the biggest themes in global markets has been “de-dollarisation.” Countries were buying more gold, adding other currencies to their reserves and gradually reducing their reliance on the US dollar. Many investors took this as evidence that the greenback’s dominance was beginning to fade.
Recent data (1Q26 IMF COFER) suggest that story may be more complicated.
Central banks increased their dollar holdings during Q1 2026, marking the first meaningful return to the US currency after several quarters of diversification (since Q1 2024). That does not necessarily mean that the long-term trend has disappeared, but we think that in periods of elevated uncertainty, the dollar still plays a role few other currencies can match.
That makes sense. During periods of geopolitical tension or market stress, central banks often prioritise liquidity over long-term strategy. US Treasury markets remain the deepest and most liquid in the world, making the dollar difficult to replace when stability becomes more important than diversification.
Investment Takeaway: The bigger lesson is that structural investment themes rarely move in a straight line. While many countries continue to diversify reserves over time, global investors should not assume the dollar is about to lose its dominant position overnight. For now, it continues to benefit whenever markets become more cautious.
Earnings Season: Can the Banks Confirm the Sector Rotation?
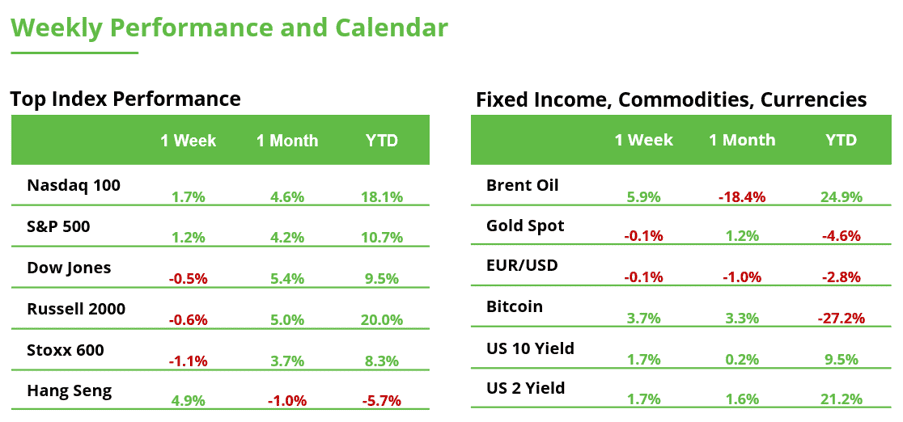
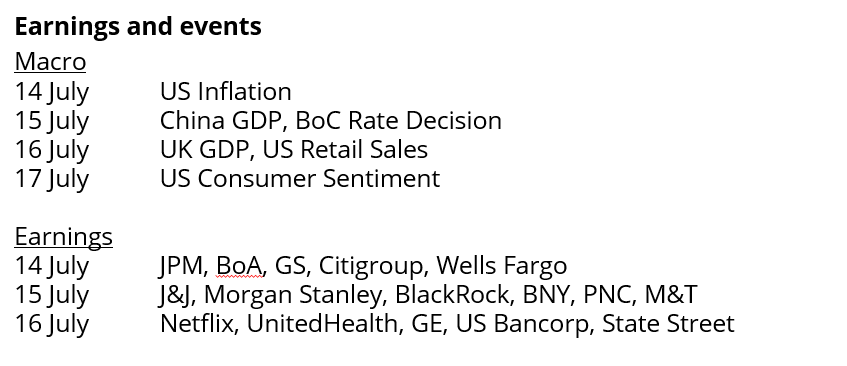
The US earnings season for the second quarter kicks off on Tuesday and could become an important test for the ongoing sector rotation. The major US banks will be the first heavyweight companies to report, making their results a key focus for investors. There are three areas to watch in particular. First, interest rate expectations and the outlook for net interest income. Second, credit risk, as the quality of banks’ loan portfolios provides valuable insight into the strength of the economy. Third, management commentary on US consumer spending.
The SPDR S&P Bank ETF (KBE) has been trading sideways for roughly two weeks. After rallying around 21% from its March low to the current level of $68.80, investors have taken a step back. The latest advance carried the ETF from $56.78 to a high of $69.90. The longer-term uptrend remains intact as long as the March low is not decisively broken. That leaves room for new highs over the coming months. If profit-taking occurs, investors should closely watch the reaction around the following Fair Value Gaps: $64.50–64.90, $60.70–62.20, and $59.80–60.00. These areas could provide support and improve the timing of new entries.
Netflix Ahead of Earnings: Chart Remains Under Pressure
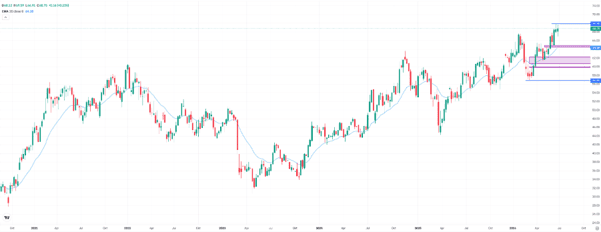
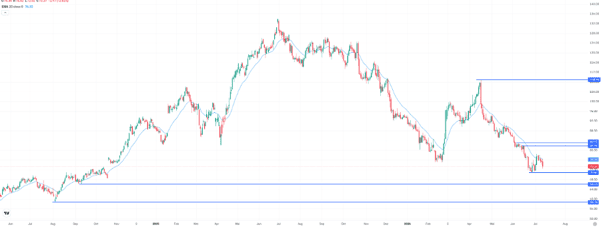
Netflix shares fell more than 5% last week, closing at $73.40. From a technical perspective, the short-term trend remains bearish. Since mid-April, the stock has continued to post lower highs and lower lows while trading below its 20-day moving average. The most recent swing low was established three weeks ago at $70.90. While the stock has stabilized since then, the rebound has not been strong enough to signal a trend reversal. For that to happen, Netflix would first need to reclaim the 20-day moving average, currently at $76.30. After that, the key resistance levels at $81.90 and $83.10 would need to be cleared, as this is where the latest wave of selling began.
Without such an improvement in the technical picture, the chances of a move back toward the year-to-date high of $108.90 remain limited. From a chart perspective, the risk of further downside is currently greater. If the June low breaks, the next support zones come into focus around $66.00 and $58.70. Thursday’s earnings report could provide the decisive catalyst for the stock’s next major move.
Markets wait for a catalyst. Financial infrastructure doesn’t.
Bitcoin has rebounded from its late-June lows, but the broader picture remains unchanged. ETF flows remain weak, the Federal Reserve continues to signal tighter monetary conditions, and liquidity is still the main driver of risk assets. At the same time, Strategy has introduced greater flexibility into its treasury policy. After a symbolic sale in May, it executed a 3,588 BTC sale in early July to strengthen liquidity and fund preferred dividends. The move does not alter its long-term conviction in bitcoin, but it does challenge the long-standing perception of Strategy as a constant buyer.
On-chain data, however, offers a more balanced perspective. bitcoin’s Realized Price now stands around $53,000, a level that has historically acted as an important reference during major market corrections. Several cycle indicators are approaching areas typically associated with late-stage bear markets, although they have yet to confirm a definitive bottom. For investors, the late-June low near $57,000 remains a key support to monitor. A sustained break below that area would increase the probability of a deeper move toward the Realized Price, where long-term holders have historically provided stronger support.
Ethereum continues to underperform, reflecting weaker on-chain activity and a clear institutional preference for Bitcoin.
Beyond short-term price action, however, a more important trend continues to unfold. The European Investment Bank, Crédit Agricole, New York Life, Fidelity, Amundi, Robinhood and Coinbase are all expanding tokenized financial infrastructure, while regulatory discussions around stablecoins and digital assets continue to mature.
For investors, the message is straightforward: short-term market performance will likely remain driven by monetary policy and capital flows, but the long-term investment case is increasingly being shaped by the steady build-out of tokenized financial infrastructure. Understanding the difference between cyclical price movements and structural adoption may prove more valuable than trying to predict Bitcoin’s next move.