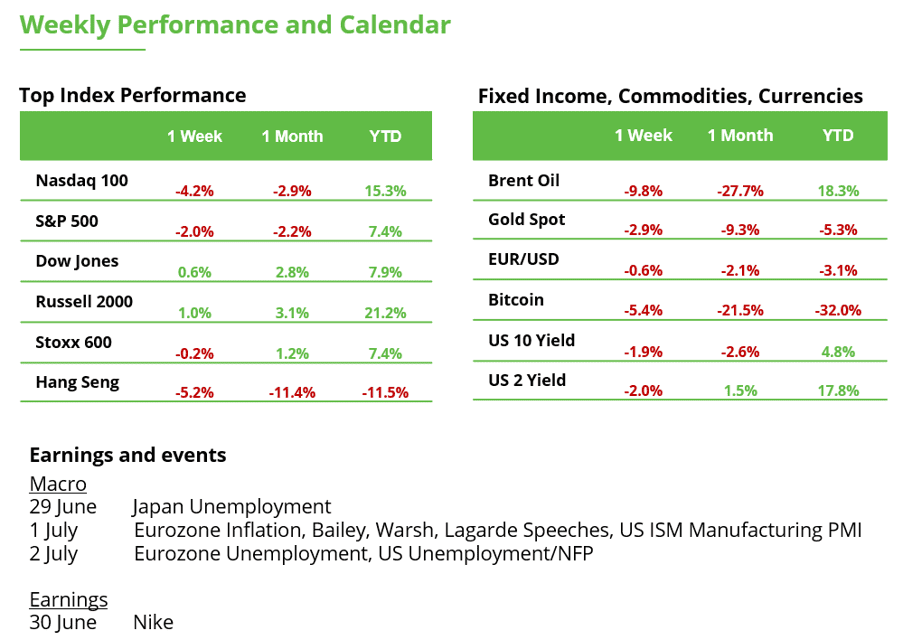


If you’ve looked at the performance of S&P 500 or Nasdaq recently, you would be forgiven for thinking the rally is beginning to lose momentum.
Yet, around 63% of S&P 500 stocks are still trading above their 200-day moving average, even after the recent pullback. On some of the Nasdaq’s worst days, more US stocks rose than fell.
Small caps are sending a similar signal. Around 70% of S&P 600 stocks remain above their 200-day moving average. If this were the start of a sustained bear market, historically speaking, smaller companies would weaken first.
Investment Takeaway: The headline indices aren’t telling the whole story. Recent selling has been driven largely by a handful of mega-cap technology names, while participation across the broader market (equal weighted index) has remained resilient. The Magnificent Seven are also starting to lose their leadership versus the broader market, suggesting investors are beginning to look elsewhere.
Looking beyond Big Tech
Notably, large US banks ($KBWB) and regional ($KRE) lenders continue to outperform, reaching fresh highs despite concerns that a flatter yield curve would weigh on the sector.
Industrial companies exposed to manufacturing, infrastructure and capital spending are also strengthening, while more healthcare companies are breaking higher after an extended period of lagging the market.
Housing, banks and REITs are strengthening at the same time, a combination that typically reflects growing confidence in the domestic economy rather than fears of recession.
Where could money go next?
Technology has attracted most of investors’ new money over the past two years, while most other sectors have attracted relatively little new capital.
As a result, many non-technology sectors remain relatively under-owned.
Any broadening in market leadership could bring fresh investor interest to financials, industrials, healthcare, real estate, utilities, energy and smaller companies.
We also think markets may be overestimating the risk of another round of Fed tightening. Current wage growth has historically been more consistent with the Fed staying on hold than hiking again. Under Warsh (see below analysis), tighter financial conditions may increasingly come from balance-sheet normalization rather than additional increases in the policy rate.
If the Fed remains on hold, investors may have greater scope to look beyond the market’s biggest technology names and towards sectors where participation is improving.
How Kevin Warsh’s Fed could reshape investing
Markets often focus on whether the Federal Reserve will raise or cut interest rates. But new Fed Chair Kevin Warsh appears to be focused on something much bigger: changing how the central bank operates.
Warsh has launched a review of the Fed’s communication, balance sheet, inflation measures and use of economic data. Rather than relying solely on higher interest rates, Warsh’s preference appears to be shrinking the balance sheet over time through financial deregulation and reserving quantitative easing (QE) for genuine crises.
He also wants policymakers to place greater emphasis on productivity, particularly the impact of AI, and to incorporate more real-time private-sector and alternative data into their decision-making.
Investment implications
If this framework takes hold, investors may need to rethink how they build portfolios. The era when abundant liquidity lifted almost every asset could give way to one where fundamentals matter more. Markets may become more sensitive to economic data, earnings and company-specific execution, making active management, stock picking and fundamental research increasingly valuable relative to simply owning broad market indices.
Warsh’s emphasis on alternative and real-time data is also notable. As official economic releases become more delayed and subject to revisions, investors may increasingly rely on private payroll data, consumer spending indicators and other alternative datasets to assess the economy ahead of traditional reports.
From an asset allocation perspective, a smaller Fed balance sheet and tighter liquidity would likely support a stronger US dollar and structurally higher real interest rates. Equities could continue to perform well, but leadership may broaden away from the narrow group of mega-cap technology stocks that dominated the liquidity-driven era.
Implications for Financials and Banks
In our view, Warsh’s emphasis on shrinking the Fed’s balance sheet through financial deregulation rather than simply keeping interest rates high could improve the long-term operating environment for banks. By reducing regulatory constraints and lowering the banking system’s reliance on excess reserves, the Fed could eventually normalise policy without maintaining permanently restrictive rates. That framework would support healthier bank profitability, improved credit creation and a more market-driven financial system, making financials and banks one of the clearest long-term beneficiaries of Warsh’s proposed reforms.
We also think that reforming banking regulations and improving the flow of credit may support mortgage lending and housing affordability without relying on extraordinary monetary stimulus.
If combined with stronger productivity growth driven by AI, this framework could allow the economy to expand while keeping inflation contained, creating a more supportive backdrop for companies with durable earnings, pricing power and long-term investment opportunities.
The broader message is that the next market cycle may reward selectivity over size, active management over passive investing, and fundamental analysis over simply following central bank liquidity. For long-term investors, identifying companies with sustainable earnings growth and strong balance sheets may matter more than ever.
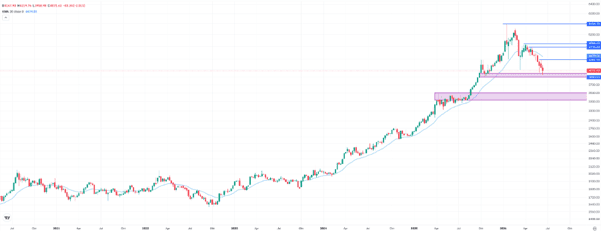
When Will Gold Turn Higher Again?
Gold fell 2.0% last week to $4,071 per ounce. At one point, the price even slipped below the $4,000 mark. This marks the fourth consecutive weekly decline, leaving gold about 27% below its record high of $5,595 reached in January. From a technical perspective, the outlook remains weak. Gold has now traded below its 20-week moving average for seven consecutive weeks, indicating that short-term momentum remains in favor of the bears. Investors should therefore be prepared for the possibility of further downside.
The next key support level lies at $3,886, the low from October 2025. If that level fails to hold, attention would shift to the $3,350–3,500 range. This area capped the rally for several months last year and could once again provide strong support. For a sustainable recovery, gold first needs to overcome nearby resistance levels. The most important ones are the high from two weeks ago at $4,382 and the 20-week moving average, currently around $4,479. A breakout above these levels would improve the technical outlook.
Why the Yield Curve Matters for Investors Right Now
The bond market remains in a state of heightened caution. Investors are demanding only a slightly higher yield to lend money to the US government for ten years rather than two. The yield on the 10-year US Treasury currently stands at 4.38%, compared with 4.10% for the two-year Treasury. The spread has therefore narrowed to around 0.31 percentage points. This represents a significant flattening of the yield curve, although it has not yet inverted. The narrow spread suggests that investors expect lower interest rates and easing inflation over the longer term. At the same time, short-term yields remain elevated because the Federal Reserve has shown little urgency to cut rates. Fed Chair Kevin Warsh recently even left the door open to potential interest rate hikes.
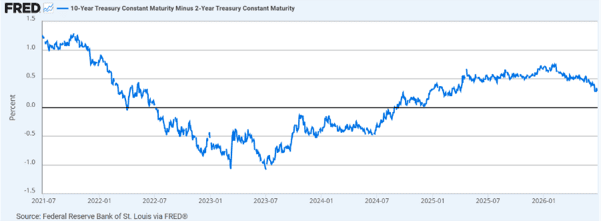
Current economic data do not point to a recession, but the Fed’s room for policy mistakes has become much smaller. This makes Thursday’s US labour market data particularly important, as they could influence interest-rate expectations and set the tone for financial markets. Investors should continue to monitor both Treasury yields and the shape of the yield curve.
Bitcoin faces its biggest supply test of 2026
Bitcoin closed one of its most challenging weeks of the year, although the primary driver once again came from outside the digital asset ecosystem. A stronger-than-expected U.S. inflation backdrop, a firmer U.S. dollar and renewed expectations that interest rates could remain higher for longer weighed on risk assets, triggering another correction across both technology equities and bitcoin.
Selling pressure was amplified by market-specific factors. Spot bitcoin ETFs recorded $1.786 billion in weekly net outflows, while the derivatives market saw more than $2.4 billion in long liquidations, accelerating downside momentum and increasing short-term volatility.
Despite the negative price action, on-chain data suggest the market is approaching an area that has historically attracted long-term buyers. Bitcoin is now trading just 9% above its realized price, currently around $53,600, a level that has often coincided with major market bottoms in previous cycles. In addition, roughly 20% of Bitcoin’s circulating supply has changed hands between $60,000 and $70,000, indicating a meaningful redistribution of coins into new ownership. Historically, this type of supply transfer has been associated with bottom-building phases, although it should not be interpreted as confirmation that a market low has already been established.
Another factor investors will continue to monitor is Strategy. As the largest corporate holder of bitcoin, any material developments regarding its capital structure or financing strategy could influence market sentiment and contribute to short-term volatility. However, the company has not announced (yet) any intention to sell its bitcoin holdings, and any scenario involving such a sale remains market speculation rather than a confirmed development.
For now, institutional flows remain the key signal to watch. As long as spot bitcoin ETFs continue to experience sustained outflows, it is difficult to argue that the market has established a durable bottom. Valuation is becoming increasingly attractive, but confirmation is likely to require a return of consistent institutional demand capable of absorbing available supply.