


The Daily Breakdown digs into ATOM and FIL before taking a closer look at the charts for Bitcoin as it tries to recover into year-end.
Before we dive in, let’s make sure you’re set to receive The Daily Breakdown each morning. To keep getting our daily insights, all you need to do is log in to your eToro account.
Crypto Corner
We’re continuing our talk about the ins and outs of the crypto market, helping investors become more familiar with the 110+ cryptoassets offered by eToro. Today we’ll discuss ATOM and FIL.
Cosmos (ATOM): Currently trading near $1.95 with a market cap of roughly $945 million
Cosmos is an interoperable Layer-0 network launched in 2019 to enable independent blockchains to communicate through its Inter-Blockchain Communication (IBC) protocol — AKA the “Internet of Blockchains.” Built with the Cosmos SDK and secured by Tendermint consensus, it emphasizes modularity and sovereignty for developers. The ATOM token is used for staking, governance, and transaction fees within the Cosmos Hub. Governed by a decentralized validator set and community voting, Cosmos underpins a growing ecosystem of interconnected blockchains without centralized control or profit-sharing.
Filecoin (FIL): Currently trading near $1.30 with a market cap of roughly $938 million
Filecoin (FIL) is a decentralized storage network created by Protocol Labs and launched in 2020, designed to provide a verifiable, market-driven alternative to centralized cloud storage. Built alongside IPFS, Filecoin allows users to buy and sell storage through an open marketplace secured by cryptographic proofs. The FIL token is used to pay for storage and retrieval, post collateral, and incentivize reliable service from storage providers. With over 10 exabytes of capacity and growing integrations — including smart contracts via the Filecoin Virtual Machine — Filecoin has become a foundational infrastructure layer for Web3, decentralized applications, and AI data storage.
Want to receive these insights straight to your inbox?
The Setup — Bitcoin
After breaking below the $107K and $100K levels, Bitcoin also flushed below its 50-day and 200-day moving average. These types of trend breaks deal technical damage to the underlying asset and result in nasty pullbacks like we’re seeing now.
So let’s get real with Bitcoin’s technicals.
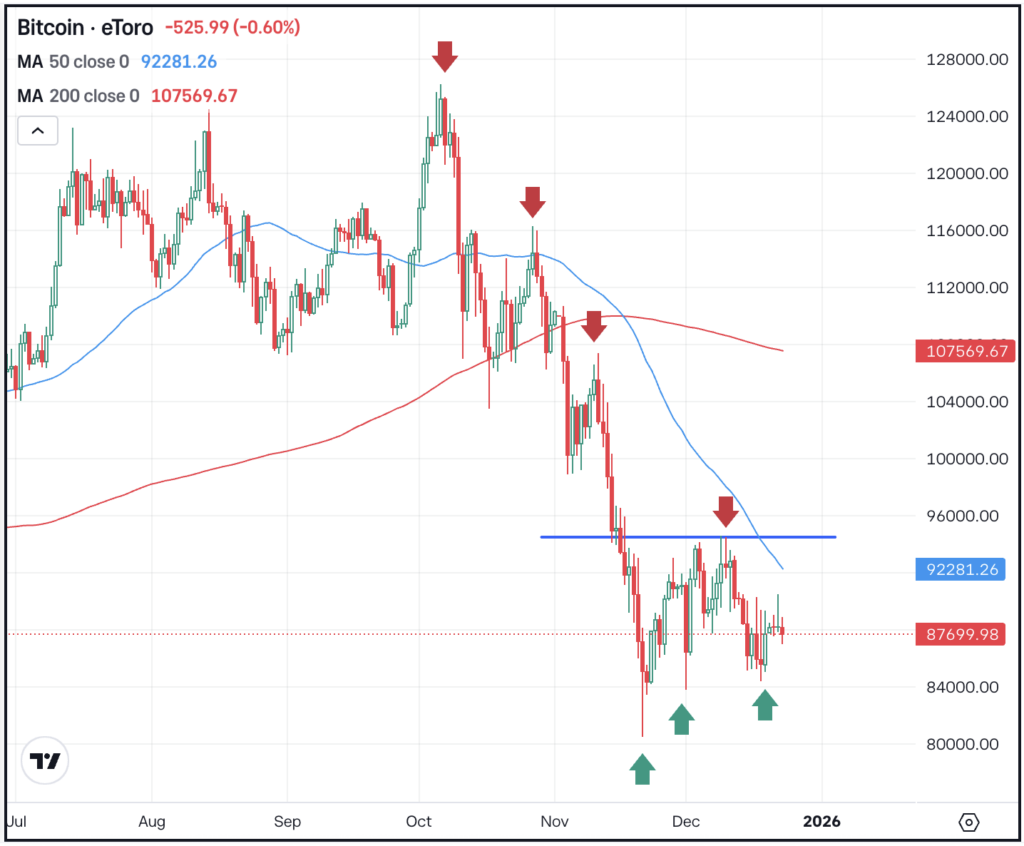
Working in the bulls’ favor is the series of higher lows on the chart (green arrows). But working in the bears’ favor is the fact that the larger trend has been lower, noted by the red arrows on the chart and the fact that BTC is still below its key moving averages.
What bulls need to see from here is clear: Bitcoin needs to build off of its higher lows, regain its 50-day moving average, and clear the $94-95K level. While that won’t undo all of the recent technical damage from this quarter, it will help restore the charts a bit and give the stock some positive momentum.
Options & ETFs
For investors who can’t trade or aren’t comfortable trading cryptocurrencies outright, they can consider ETFs for BTC and ETH. On the BTC front, IBIT remains the largest ETF by assets, while also supporting options trading.
Bulls can utilize calls or call spreads to speculate on upside, while bears can use puts or puts spread to speculate on downside. In either case, investors may consider using adequate time until expiration.
For those looking to learn more about options, consider visiting the eToro Academy.
What Wall Street’s Watching
GOLD
Gold prices hit new record highs on Monday, as it approached $4,450. That momentum carried into Tuesday, with gold notching yet another record. Silver has continued its strong run as well, now trading above $70. The sustained rally in precious metals has provided a significant tailwind for ETFs like GLD and SLV.
RKLB
Rocket Lab shares have been on a tear, rising 10% on Monday after last week’s strong performance, which included an 11% rally on Thursday and a 17.7% surge on Friday. While the stock is down about 5% in pre-market trading today, bulls are encouraged by its return to new highs after falling nearly 50% from earlier-quarter peaks. Take a look at the chart for RKLB.
Disclaimer:
Please note that due to market volatility, some of the prices may have already been reached and scenarios played out.