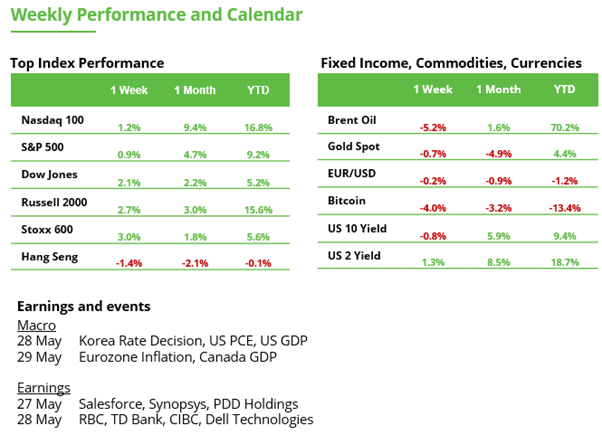



The S&P 500 keeps pushing to new highs and AI optimism remains the dominant theme, yet tech valuations themselves have not exploded higher. Instead, most of the gains this year have come from earnings growth rather than investors aggressively bidding up multiples.
The market is essentially saying: show me the profits.
And so far, big tech has delivered. Earnings growth across the sector has been strong enough to justify much of the move higher, particularly among semiconductor names tied to AI infrastructure spending. Nvidia continues to sit at the heart of that story, but the enthusiasm has not lifted every corner of tech equally. Software stocks, for example, have actually seen valuation pressure this year, helping keep the broader sector’s average multiple from overheating.
That is one reason today’s setup does not yet resemble the final phase of the late-1990s bubble.
Back then, valuations detached from reality as investors chased momentum regardless of fundamentals. Today’s market still appears more selective.
But there is an uncomfortable historical parallel worth watching.
In 1999, tech multiples also spent much of the year moving sideways before eventually surging into the euphoric peak of early 2000.
In other words, valuation excess did not happen overnight. It came late in the cycle.
What ultimately broke sentiment back then may also be relevant today. Japan’s recession in early 2000 is an overlooked trigger that helped crack confidence around global growth and technology demand at the margins.
The lesson is that bubbles do not always end because valuations get too high. Sometimes they end because the macro backdrop changes.
So, we are watching the macro backdrop in Asia too. One indicator- South Korea’s export data- remains strong, suggesting AI-related chip demand is still holding up globally. But if growth in Asia begins to slow, especially around semiconductors and AI infrastructure spending, investors may start questioning whether current earnings expectations are sustainable.
For now, the AI trade is being supported by fundamentals. The question is whether that discipline holds if enthusiasm keeps building.
NVIDIA’s AI Engine
NVIDIA delivered another “beat-and-raise,” as results came in ahead of expectations and the company also raised its outlook. The main driver was strong demand from datacentres, where companies are buying NVIDIA chips to build and run AI systems.
Investment Takeaway: AI infrastructure spending is still translating into very strong revenue growth for NVIDIA, and not just hype.
Networking is becoming a bigger part of the story
Networking revenue hit $14.8bn, up 35% quarter-on-quarter and nearly doubling year-on-year.
Networking business includes the hardware and technology that connects thousands of AI chips inside a datacentre so they can work together as one large system. Training and running advanced AI models requires huge clusters of GPUs, and those chips need very fast connections to move data between them.
Investment Takeaway: That matters because NVIDIA is not only selling the “brains” of AI, the GPUs, but also more of the infrastructure around them. This supports the view that NVIDIA is becoming a broader AI infrastructure platform, not just a chip supplier.
Guidance points to continued momentum
NVIDIA guided next-quarter revenue to $91bn, ahead of consensus at $86.4bn, with management expecting sequential growth to continue through calendar 2026 and into 2027.
Investment Takeaway: For retail investors, this is important because the market does not only care about what NVIDIA has already delivered. It also cares about whether the company can keep growing from an already very large base. The guidance suggests demand remains strong.
Datacentre is still the engine
Datacentre revenue reached $75.2bn, up 21% quarter-on-quarter and 92% year-on-year.
Datacentres are the large facilities that house the computing power used by cloud providers, AI companies, enterprises and governments. In NVIDIA’s case, this segment includes demand from major cloud and AI infrastructure buyers.
Investment Takeaway: NVIDIA’s growth is still being driven by the AI buildout, especially by large customers investing heavily in computing capacity.
New growth optionality: Vera CPU
Around $20bn of incremental standalone Vera CPU revenue visibility is expected this calendar year.
A CPU is the general-purpose processor often described as the “central brain” of a computer or server, while a GPU is better suited to the parallel processing needed for AI workloads. NVIDIA is best known for GPUs, but Vera suggests the company is moving deeper into the broader server market.
Investment Takeaway: NVIDIA may have another growth opportunity beyond GPUs, expanding its role inside AI servers.
Shareholder returns are improving
The board approved an $80bn incremental buyback, taking available authorization to $118.5bn, and raised the quarterly dividend from $0.01 to $0.25.
Investment Takeaway: This is still secondary to the AI growth story, but it shows NVIDIA is starting to look more like a highly profitable mega-cap that can both invest for growth and return cash to shareholders.
China is upside, not in the base case
The outlook assumes zero China datacentre compute revenue, so any meaningful progress from H200 licensing would be upside to estimates.
Investment Takeaway: China remains a geopolitical risk, but also a potential source of upside if restrictions ease or licensing improves.
Valuation remains the main watchpoint
NVIDIA’s fundamentals remain very strong, but the share price already reflects a lot of optimism. The company may still be an AI leader, but expectations are high, so any disappointment on growth, margins or AI demand could matter more.
Nasdaq at Record Highs: Is the Rally Overheating?
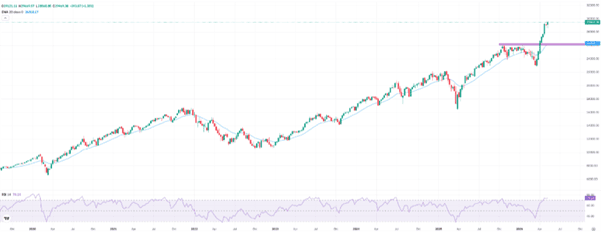
The Nasdaq gained 1.4% last week and closed just below the 30,000-point mark at a new record high. Since the March low, the tech heavy index has now recovered by around 29%. The previous all-time high was surpassed surprisingly quickly. What stands out is that the recovery has been far more dynamic than the preceding correction. Even after the Covid crash, the rebound was not this rapid, although the decline back then was significantly steeper.
In the best-case scenario, the market is now returning to an environment in which new highs are reached while normal pullbacks of around 3% to 6% occur along the way. At the same time, the market has moved higher over recent weeks with hardly any meaningful correction. As a result, the Nasdaq has now remained in overbought territory for roughly three weeks according to the RSI indicator, which is currently above 74. However, this should not necessarily be interpreted as an immediate signal for a trend reversal, but rather as an indication of how strong the recent momentum has been.
If a larger pullback does occur, the breakout level around 26,200 points together with the slightly higher 20-week moving average could act as important support. From a medium- to long-term technical perspective, the intact uptrend structure still points toward further highs ahead.
Bond Market Remains Stuck in Sideways Range
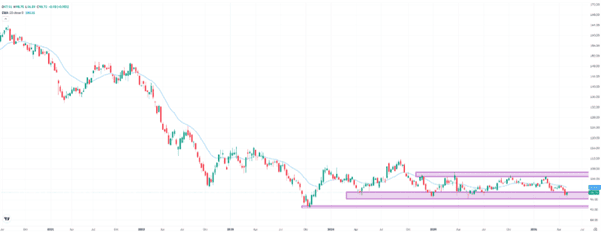
The bond market (TLH: iShares 10–20 Year Treasury Bond ETF) managed to reverse earlier losses last week and closed around 1% higher at $99.73. This temporarily ended a three-week losing streak. Despite the recent stabilization, the market has been trading in a broad sideways range for more than two years. Short-term directional swings continue to occur, but without the emergence of a clear upward or downward trend.
Most recently, buyers once again reacted to the well-known support zone between $96 and $99. This prevented another stronger selloff and a potential retest of the 2023 low around $93. On the upside, prices continue to face resistance in the $105 to $107 area. Technically, the market therefore remains trapped in a clear sideways pattern.
A move back above the 20-week moving average around $101 would improve the chances of another test of the upper boundary of the range. Only a sustainable breakout above that level would open the door for renewed upside potential. If buyers fail again near the moving average, the lower end of the range is likely to come back into focus.
Bitcoin’s Identity Crisis
Bitcoin continues to show a very different structure compared to previous bear market cycles. Over the last week, nearly USD 1.2 billion has left Bitcoin ETFs and the price still fails to recover key levels. But at the same time, we are not seeing clear signs of structural capitulation inside the ecosystem.
And that is probably the key point. Historically, Bitcoin bear phases tended to last around one year. It has now been roughly 227 days since the October highs and, despite all the recent pressure, Bitcoin continues to move sideways between USD 60K and USD 80K without definitively losing that range. That matters because previous cycles were far more violent and vertical on the downside.
In addition, long-term holders have stopped selling and many on-chain metrics remain far from signalling cycle destruction.
The issue now is different: capital no longer flows automatically into Bitcoin. Part of the speculative liquidity is rotating toward AI, semiconductors and quantum computing, while Bitcoin continues to show relative weakness versus the Nasdaq.
Since Bitcoin lost the USD 90,000 level, the market has not seen aggressive capital inflows return, and that is an important signal because institutional flows were precisely what drove a large part of this cycle’s upside. When that demand disappears or loses intensity, Bitcoin struggles to reclaim levels quickly and tends to enter longer consolidation phases, creating the feeling that the market still lacks the urgency buying typically associated with the beginning of a strong new bullish phase.
That is why the market feels so confusing right now: price action looks weak, ETF flows have deteriorated, but the internal structure of the ecosystem still does not behave like a classic end-of-cycle scenario.
And that raises the possibility that this phase is not simply a traditional bear trend, but rather a transition period in which the market is redefining how Bitcoin should be valued within a crypto ecosystem that is now far more mature, institutional and competitive than in previous cycles.
Bitcoin is now testing the key USD 74,500–75,000 area in a clear sign of short-term weakness, increasing the risk of further downside toward the lower end of the range built since February. Even so, the broader structure remains intact as long as Bitcoin holds above the USD 68,000 zone, where strong buying interest previously emerged. On the upside, USD 80,000–82,000 remains the major resistance area that must be reclaimed before talking about a real recovery. Right now, the market still looks much more like a base-building and consolidation phase than a solid bullish trend.