


Use practical examples to understand moving averages in trading. Learn how to include moving averages within advanced technical analysis.
Moving averages (MA) are a staple of any trader’s toolkit and are among the most important metrics behind any decision to buy or sell. They work using simple mathematical principles, but leveraging them to their full potential enables you to draw on more advanced aspects of technical analysis.

Why are moving averages essential indicators in trading?
Moving averages are essential
Advanced technical analysis tools and strategies can help to make moving average signals even more useful, although traders should always consider the two main directions (rising and falling) of moving average indicators. Using advanced tools can help traders to choose the type of moving average and average-based trading strategy that suits their individual investment needs.

Why incorporate moving averages with advanced applications?
Investors can incorporate different moving average metrics with advanced trading techniques (metrics other than simple moving averages) to help define and hone in on certain periods of market sentiment. The simple moving average (SMA) gives a clear representation of long-term price trends, but is somewhat limited due to its wide view of market trends. Consequently, other averages have been developed to offer a different perspective of the markets.
| Exponential Moving Average (EMA) | Linear Weighted Moving Average (LWMA) | Smoothed Moving Average (SMMA) |
|---|---|---|
| Provides greater weighting to more recent price data (the SMA gives equal weighting to the data points, regardless of when they were recorded). | A formula that gives greater weighting to recent prices, but also allocates less importance to older data points. | Based on EMA principles, this average uses a greater number of data points to smooth out the readings. |
The different types of averages can give more relevant readings depending on the type of strategy you are running. Traders running short-term strategies, for example, are more interested in recent events, so they often opt to use an EMA rather than an SMA to guide their decision-making. However, using higher time frames in a MA strategy can often provide more accurate signals.
Tip: Exponential moving averages multiply more recent data points by a predetermined factor before including them in the calculation.
How to actively use moving averages?
Traders can use various moving average indicators in a variety of trading scenarios, and, on a stand-alone basis, these figures depict the general direction in which a market is heading. When averages that measure different time frames intersect, the crossover can potentially signal that a trend is about to turn.
Tip: The much-used golden cross indicator occurs when a short-term moving average intersects a longer-term one.
In the example below, the shorter-dated 9-Day SMA intersects the longer-dated 26-Day SMA to the downside. This shows a signal that the upward trend in the bitcoin market was weakening as sellers had dominated more recent trading activity.
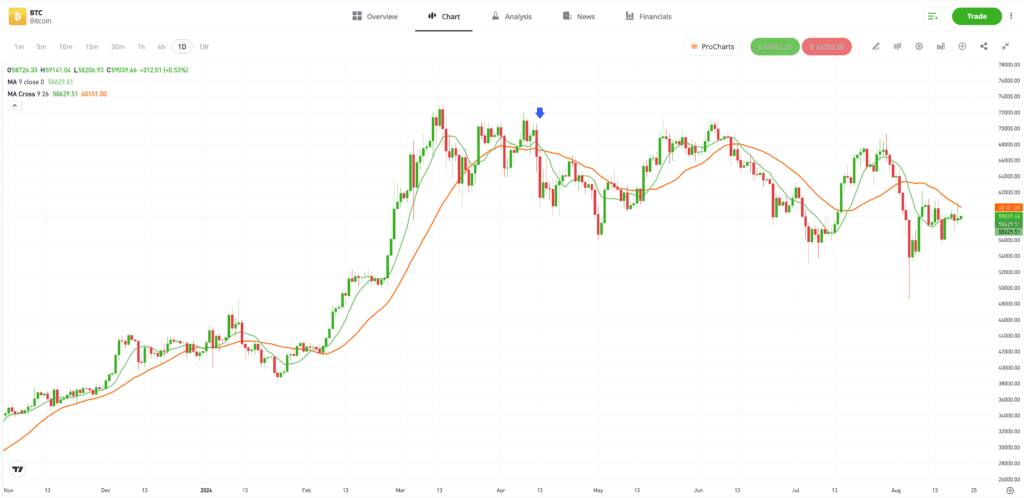
Past performance is not an indication of future results.
Source: eToro
To make things simpler, some platforms include the MA Cross indicator, which highlights moments when averages intersect.
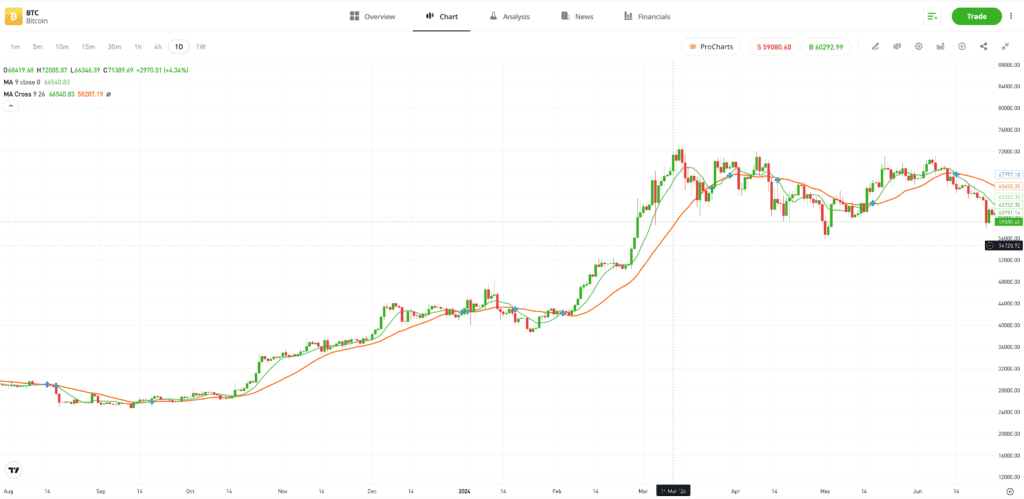
Past performance is not an indication of future results.
Source: eToro
How to combine moving averages with other indicators?
You can improve your understanding of market conditions by introducing MA indicators that measure momentum. By doing so, you can better understand the direction of the trend and the strength of weight behind it.

In the example below, taken from the NASDAQ 100 Index price chart, the 35.9 Relative Strength Index (RSI) reading signals that the market is
Traders can combine averages and momentum indicators as part of an ongoing trade management strategy to decide whether they should remain in winning positions or cut their losses. In the same price chart, the 5-Day SMA crosses the 50-Day and 100-Day SMAs, which is another bullish signal. This is also done at a time when the RSI reading is 55, and so is still some way off from indicating that the market is oversold. As it turns out, remaining in the long position would have been beneficial as the price of the index continued to rise.
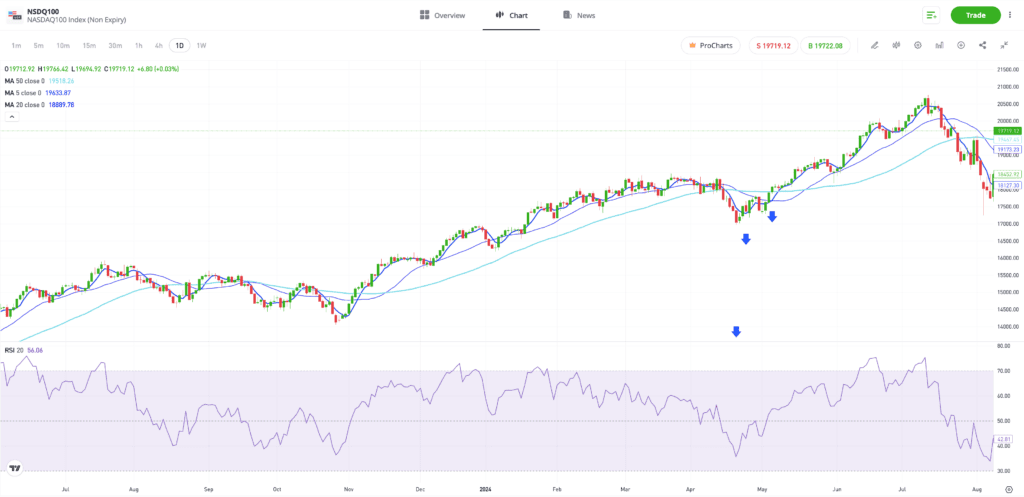
Past performance is not an indication of future results.
Source: eToro
Fine-tuning a trading strategy using moving averages
A strategy that incorporates MA indicators can be useful, but traders should consider the nuances of each MA indicator. For example, it is important to pay particular attention to the time frame and time interval settings of the chart as these can show varying price trends over varying periods of time.
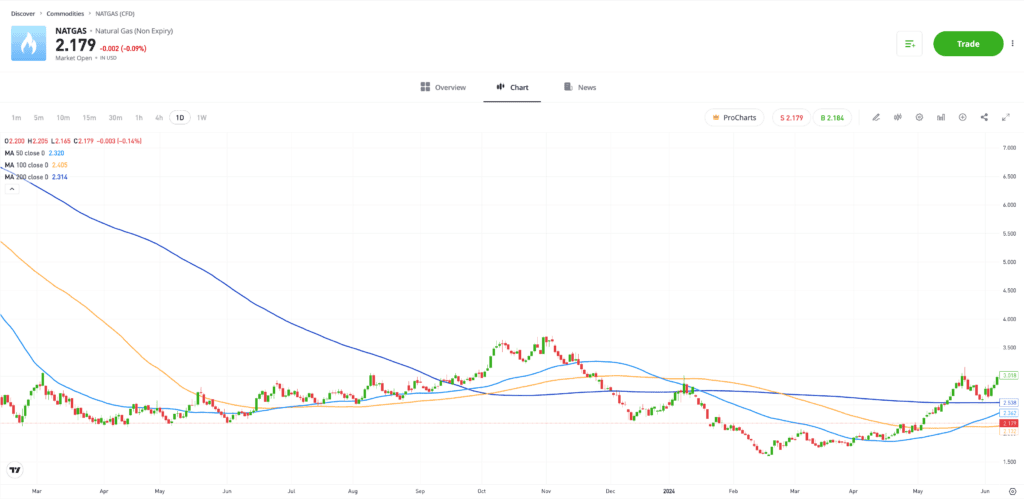
The charts below show daily candles in the Natural Gas market that have been overlaid with SMAs with different time frames.
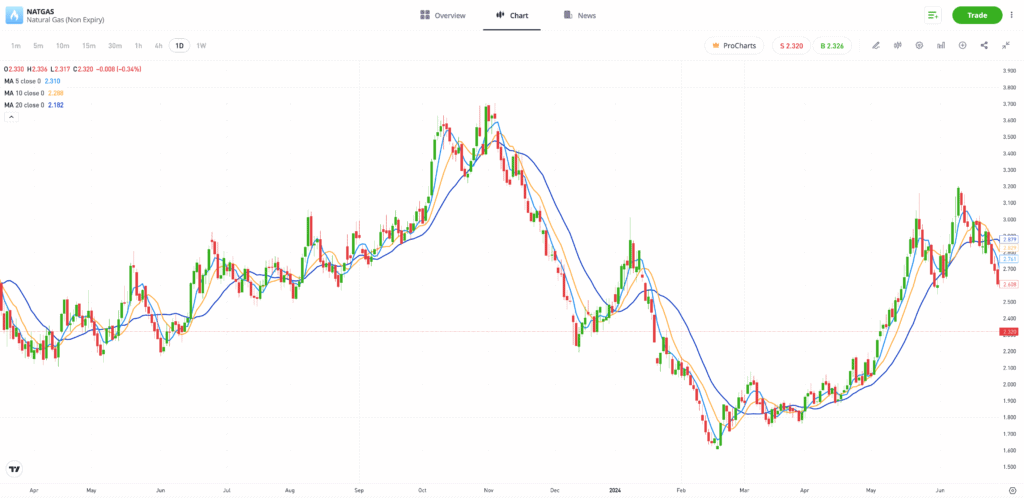
Past performance is not an indication of future results.
Source: eToro
A trader applying short-term strategies may find more benefit from using a chart with SMAs of 5, 10 and 20 days, as seen in the example above. However, a longer-term strategy would use signals from a chart with 50-, 100- and 200-day averages, similar to the example below. The average used works best when it’s in line with the time horizon of the trade holding period.
Past performance is not an indication of future results.
Source: eToro
Final thoughts
Moving averages are a core element of technical analysis. They are powerful and versatile tools that can help to adapt advanced trading techniques in various ways. Exploring the more advanced types of averages and strategies they support can help to take your trading to the next level.
Learn how to use indicators in trading on the eToro Academy.
Quiz
FAQs
- How can traders use moving averages to determine market momentum and volatility?
-
If an average is becoming smoother, then
volatility is potentially dropping out of the market, and vice versa. The direction of a moving average gives traders a clue as to what the underlying trend is, depending on its direction — upwards, downwards or sideways. When averages of different time frames cross, the point of crossing can be a sign that momentum is about to change direction. - What are the benefits and limitations of using moving averages in conjunction with other indicators?
-
Moving averages are lagging indicators, meaning that the data used to generate them is all historical. As a result, the indications have to be treated with care when establishing what will happen in the future. Despite this, they have a strong track record of being useful trading tools to decipher where a trend may be headed.
- How can traders adjust moving average parameters to suit different trading styles and market conditions?
-
Most online brokers allow traders to click on a moving average indicator and adjust the parameters, such as the time frame, involved. The shorter the timeline of your planned strategy, the more likely that shorter dated moving averages will be a better fit in terms of generating trading signals.
This information is for educational purposes only and should not be taken as investment advice, personal recommendation, or an offer of, or solicitation to, buy or sell any financial instruments.
This material has been prepared without regard to any particular investment objectives or financial situation and has not been prepared in accordance with the legal and regulatory requirements to promote independent research.
Not all of the financial instruments and services referred to are offered by eToro and any references to past performance of a financial instrument, index, or a packaged investment product are not, and should not be taken as, a reliable indicator of future results. The availability of all the above-mentioned products and services may vary by jurisdiction and country.
eToro makes no representation and assumes no liability as to the accuracy or completeness of the content of this guide. Make sure you understand the risks involved in trading before committing any capital. Never risk more than you are prepared to lose.