


Commodities are back in “something broke” mode. Oil, gas, copper, aluminium and gold are all being lifted by the same theme: the world looks short of the things it needs most.
Resource stocks (BHP, Rio Tinto, Vale, Freeport-McMoRan), industrial metals (copper, aluminium, zinc, nickel and iron ore), memory names (Micron, SK Hynix, SanDisk) and capex-linked industrial cyclicals are acting well.
To us, this suggests that investors are positioning for a world where physical assets matter again: power, grids, data centres, defence, reshoring and electrification all need more energy and materials.
That creates a useful split for retail investors. The weaker side of the market is the consumer economy (discretionary, staples), where higher input costs and affordability pressure still bite. The stronger side is the industrial economy, where scarcity can become pricing power.
So the portfolio question is not “should I buy commodities?” It is: do I have enough exposure to the parts of the market that benefit when the cost of real-world capacity goes up? Commodity-linked portfolios, energy, materials, infrastructure and industrial themes are cleaner ways to express that view than chasing single price spikes.
The risk is China and rates. If Chinese demand softens, metals may lose their growth signal. If commodity strength keeps inflation and yields high, the scarcity trade can become a headwind for broader equities.
Post-Summit Thoughts: Trade Calm, Treasury Stress
The US-China summit reduced the immediate risk of a full-scale trade escalation, but markets are now shifting their focus toward what comes next: implementation, geopolitics, and the Treasury market.
Initial takeaways point to a more transactional relationship, with China expected to increase purchases of US agricultural products, energy, and Boeing aircraft, while both sides continue discussions through a new Board of Trade and Investment framework. Notably, as we had expected, there was little evidence of a breakthrough on advanced semiconductors, suggesting restrictions around NVIDIA and AI-related exports are likely to remain a structural tension point.
For markets, we think that the bigger implication may be outside trade itself. Investors are increasingly pricing in geopolitical risk tied to the Middle East and higher long-term Treasury yields now that the US administration has returned to Washington.
The long duration Treasuries are increasingly getting under pressure with deficits , defense spending, and softer liquidity conditions pushing yields higher. That raises the probability of policy intervention later this year, including potential Treasury buybacks or liquidity measures if funding markets tighten further.
Investment Takeaway: Tariff fears may have eased temporarily, but investors are entering a phase where bond yields, fiscal policy, and geopolitical risk matter more than headline trade diplomacy.
Bond Markets Are Flashing a Higher-for-Longer Warning
Bonds, not tariffs or even the Fed, are increasingly becoming the market’s biggest driver.
Bond markets are increasingly signalling that investors may be entering a higher-for-longer yield regime. Treasury yields have surged since late February, with the 10-year climbing above 4.5% and the 30-year moving back toward 5%, levels not consistently seen since before the Global Financial Crisis. And this is not just a US story. Government bond yields in Europe, the UK, and Japan have also been rising as investors reprice inflation risks, political uncertainty (UK), higher energy costs, and growing fiscal pressures globally.
The bigger concern is that the US appears to be struggling to contain the rise in longer-term borrowing costs. Earlier this year, Treasury eased pressure by leaning more heavily on short-term borrowing through bill issuance rather than longer-dated Treasuries. But rising defense spending, persistent deficits, and higher oil prices linked to Middle East tensions are now pushing inflation fears back into markets. Investors are demanding higher returns to hold long-term government debt, especially as risks around the Strait of Hormuz keep energy markets on edge.
Investment Takeaway: For investors, this matters because higher bond yields ripple across markets. Expensive borrowing costs can weigh on equities, particularly growth and technology stocks, while also tightening financial conditions for consumers and businesses. In fact, if yields continue climbing, policymakers may eventually step in with liquidity measures or Treasury buybacks to stabilize markets.
Nvidia Stock Swings Sharply Ahead of Earnings
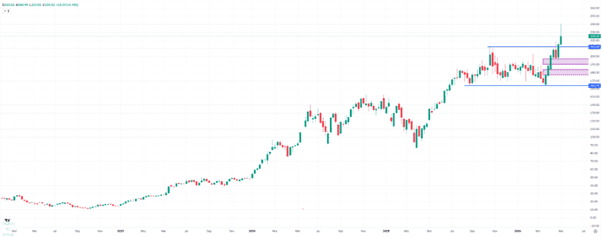
Nvidia shares came under significant pressure on Friday, falling more than 4%. Earlier that same day, however, the stock had reached a new record high of around $241. Despite the sharp volatility, Nvidia still ended the week up nearly 5% at $225 US.
A similarly abrupt short-term reversal was also visible across the broader market. Investors are likely to remain cautious ahead of Nvidia’s Q1 earnings and updated guidance on Wednesday evening. The long-term uptrend in the stock remains intact, which from a technical perspective still supports the case for a continuation of the rally. Fundamentally, Nvidia once again needs to deliver very strong numbers, as market expectations remain extremely high.
If the stock experiences further pullbacks after earnings, two potential zones come into focus. The first lies between $190 and $197, while the second sits lower between $177 and $184. From a long-term perspective, such declines would not necessarily be unusual or catastrophic, as long as one of these zones can absorb the selling pressure. For long-term investors, stronger pullbacks could even create more attractive entry opportunities. Only a break below the $164 area would significantly damage the technical picture and suggest that buyers are losing control. Since August 2025, this level has repeatedly acted as support.
Taiwan ETF Weakens After Record High
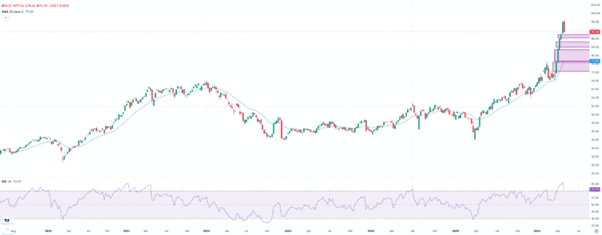
The iShares MSCI Taiwan ETF (EWT) lost around 5% last week and closed above $91. This marked the first losing week after six consecutive weeks of gains and a series of new record highs. So far, the current pullback appears more like a normal pause within the broader uptrend. At the same time, the RSI remains above 72, signaling a short-term overbought market condition. This does not necessarily mean the ETF cannot continue to rise, but it does indicate that the rally has already become quite extended and that short-term entries now involve higher risks.
The long-term uptrend still points toward higher highs over time. However, if profit-taking intensifies, several technical zones come into focus. The chart currently shows four Fair Value Gaps — a sign of how rapidly the ETF has climbed in a short period of time. The most important zone lies between $77 and $83. This area also coincides with the 20-week moving average, which serves as a key technical support level. After such a strong rally, a pullback toward the moving average would not be unusual from a technical perspective.
Bitcoin’s Long-Term Structure Holds as Macro Pressure Clouds the Short Term
Bitcoin continues to show a healthy long-term structure, but the short-term environment has clearly weakened.
The market has just completed a full round-trip in less than 48 hours. BTC rallied toward $82K following optimism around the CLARITY Act, only to give back the entire move as the bond market reasserted itself. The real trigger was not crypto-specific. It was the sharp move higher in long-duration Treasury yields, with the U.S. 30-year yield climbing above 5%, tightening financial conditions across risk assets.
That remains the key macro variable investors need to monitor. Bitcoin is still trading within a liquidity-driven environment where inflation expectations and interest rates continue to dominate short-term price action.
From a structural perspective, however, the broader setup remains constructive. On-chain data does not yet resemble a late-cycle market:
- MVRV Z-Score remains far from historical cycle-top levels.
- Exchange balances continue to decline, reflecting reduced liquid supply.
- Spot ETFs now hold approximately 1.3 million BTC, around 6.5% of total supply.
- Realized Cap continues to trend higher without signs of speculative excess.
In other words, the long-term framework still looks more consistent with consolidation inside a broader uptrend than with a completed cycle top.
Tactically, though, conditions have deteriorated:
- Bitcoin ETFs recorded more than $1 billion in weekly outflows, ending a six-week streak of inflows.
- Fear & Greed has returned to fear territory near 27.
- Funding rates remain negative while Open Interest stays elevated.
- Options positioning continues to cluster around the $77K–$78K Max Pain zone.
Most importantly, the options market is not showing directional conviction.
Positioning data reveals simultaneous demand for upside exposure through calls in the $84K–$90K range while, at the same time, investors continue adding downside protection through puts between $69K–$75K. This is not the behavior of a market pricing a clear trend. It reflects uncertainty around the next macro move.