


Support and resistance levels are crucial elements of technical analysis. Use practical examples to develop your understanding of support and resistance levels.
Trading using support and resistance levels involves using charting techniques to identify patterns on price charts. This can be utilised to indicate the likelihood that a current price trend may end and possibly revert.
Support and resistance levels can be easy to identify, and there are plenty of real-life examples of them guiding price moves. Using advanced techniques offers a way to avoid some of the possible pitfalls of trading and helps to optimise returns.

Why are support and resistance important?
Support and resistance levels are important because when a sufficient number of individual traders consider a particular price level to be significant, the wider market will often trade in a certain direction if price reaches that point.
While it is easy to understand why certain price levels act as a barrier to price moves, the reasons for them forming are more nuanced and are often impacted by psychological factors. Identifying support and resistance levels involves acknowledging some of the price points that might be followed by other traders. These include:
- Previous highs
- Previous lows
- All-time highs
- All-time lows
- Psychologically important price levels
Previous highs and lows mark a point in time when the majority of market participants believed that an asset was becoming over or
High and low support and resistance levels work on the basis that unless there has been a fundamental shift in the reasons behind an instrument’s valuation, there is a greater chance that price will bounce off that level again.
Psychologically important support and resistance levels, also known as “big numbers,” are key price levels that cause traders to stop and consider whether or not the market is overshooting — for example, the price of oil trading above $100 per barrel, or bitcoin trading above $100,000.
Tip: The success of support and resistance strategies can be attributed to the levels acting as self-fulfilling prophecies.
Case studies of support and resistance in action
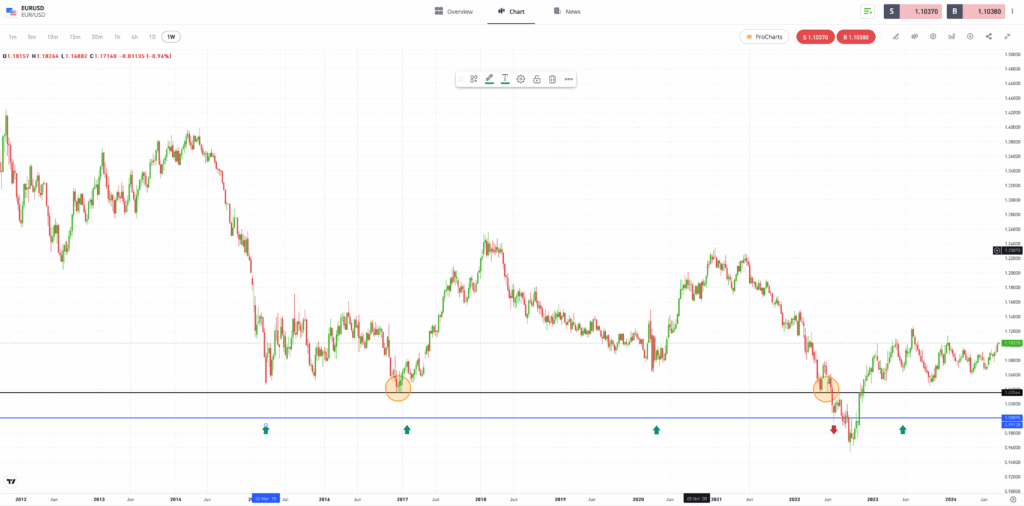
Exploring case studies can help traders to understand real examples of support and resistance levels. A market that has historically demonstrated significant support and resistance levels is the Eurodollar currency pair. In the 20 years between 2002 and 2022, the lowest price recorded in EURUSD was 1.0357, in January 2017. It traded in a relatively wide range, sometimes close to that support level and the 1.000
Another support level that influenced market traders was the 1.0000 parity price level, despite only being a psychological barrier. This barrier was based on the multi-year convention that the dollar was less valuable than the euro.
Past performance is not an indication of future results.
Source: eToro
This changed in 2022, when EURUSD first tested the January 2017 low and then the 1.000 parity level. Price charts show that there was support at each level before price broke through. Although EURUSD traded as low as 0.96, the dip was relatively short-lived, with price soon returning to trade above both price support levels.
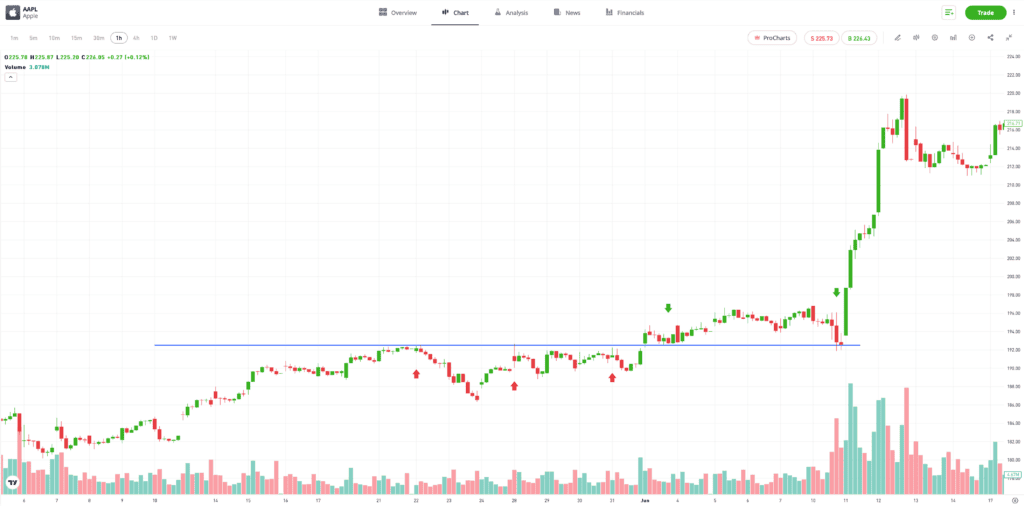
It is also common for support to turn into resistance (and vice versa) once a specific level has been broken. In the Apple chart below, price bounces off the $192 resistance level three times before eventually breaking through it. This level then acted as one of support when tested, which was a bullish indicator that pointed at an upcoming trend reversal. The asset’s price eventually saw a significant move to the upside after failing to break through its newfound support.
Past performance is not an indication of future results.
Source: eToro
How to create advanced strategies using support and resistance?
Support and resistance levels are popular among traders who take a more speculative approach, but there are different ways to approach the situation and using these indicators can help to advance individual trading strategies to the next level.
Support and resistance levels can act as a magnet. When the price of an asset is nearing an important price level, some traders enter into short-term positions in the hope of capitalising on the level being tested or broken.

Integrating support and resistance with other indicators
The signal from an indicator, such as a resistance level, becomes stronger if other indicators give off a confirmatory signal. Momentum-based indicators such as the moving average convergence/divergence (MACD) and Relative Strength Index (RSI) offer insights into market mood. They are particularly useful and are particularly useful when trying to establish if a support or resistance level will hold, or if other factors could be about to trigger a breakout.

Final thoughts
Support and resistance levels work on the assumption that price trades within a certain range. The popularity of these strategies can often create a herd mentality, which can also be traded by advanced investors.
To learn more about support and resistance levels, visit the eToro Academy.
Quiz
FAQs
- What makes the identification of support and resistance levels challenging in advanced trading?
-
The more significant support and resistance levels, such as “all-time highs,” develop over time. When trading using short-term strategies, the market may be trading within a price range that is a considerable distance from major levels.
- What other indicators work well with support and resistance levels to provide optimal results?
-
Indicators that measure momentum combine well with analysis of support and resistance levels. Oscillators, for example, monitor the strength of price moves rather than their direction. Used in conjunction with support and resistance levels, these can offer an insight into whether price will revert to follow the existing trend due to momentum waning, or if there is sufficient buying or selling pressure for price to break out and form a new trend.
- What are some common pitfalls to avoid when applying advanced support and resistance techniques?
-
Stop-loss instructions placed too close to a support/resistance level may well be triggered and a loss may be crystalised. This is more likely to be the case if many other traders have identified the same level, and also set their own stop-losses close to that trade entry point. Similarly, prioritising shorter time frames over higher ones may cause inaccurate trend analysis because higher time frames often hold more weight than shorter ones.
This information is for educational purposes only and should not be taken as investment advice, personal recommendation, or an offer of, or solicitation to, buy or sell any financial instruments.
This material has been prepared without regard to any particular investment objectives or financial situation and has not been prepared in accordance with the legal and regulatory requirements to promote independent research.
Not all of the financial instruments and services referred to are offered by eToro and any references to past performance of a financial instrument, index, or a packaged investment product are not, and should not be taken as, a reliable indicator of future results. The availability of all the above-mentioned products and services may vary by jurisdiction and country.
eToro makes no representation and assumes no liability as to the accuracy or completeness of the content of this guide. Make sure you understand the risks involved in trading before committing any capital. Never risk more than you are prepared to lose.