


Develop your understanding of the RSI indicator using practical examples. Learn how to integrate these indicators to enhance individual advanced technical analysis.
The Relative Strength Index (RSI) is a popular technical indicator used by investors interested in the potential momentum of a trade. Investors can advance their trading strategy by considering the other market insights that this indicator has to offer.

What is the Relative Strength Index?
The RSI is an indicator that helps traders to identify moments when a market might be
It is important to understand the metric from which the RSI indicates overselling and overbuying. The RSI ranges between 0 and 100. It will read below 30 when the market is oversold and above 70 when the market is overbought.
Other number levels can also be considered. For example, during a sustained upward trend, the RSI may give a reading greater than 70 for a sustained period of time. This means that the RSI would generate a false signal for anyone looking to short the market, but those looking to follow the trend could consider RSI levels of 40 and 50 as support levels, and opportunities to buy the dip.
The patterns formed by the RSI can also be used to measure momentum and spot moments when a trend might be about to end. A divergence between price action and the RSI reading occurs when price prints a higher high, or lower low, and at the same time, the RSI registers a lower high, or higher low. Regardless of whether the underlying trend is upward or downward, a divergence between price action and RSI is a signal that the trend could be about to end.

How to use advanced RSI strategies in trading
Investors can work to create an advanced trading strategy by working off RSI levels other than 30 and 70. If accompanying indicators are aligned with your proposed trading idea, then entering the trade when the RSI is greater than 30 may mean that you don’t miss out on the opportunity. Entering a trade at a reading of 35 would be a more aggressive approach, but one that might suit market conditions.
Alternatively, adopting a more conservative approach, and using 25/75 or 20/80, would allow you to enter a trade that is likely to have a higher win/loss probability. Should the RSI reach that lower level, you would benefit from other traders who used the 30/70 levels, having already been stopped out on their trades and moving the RSI to a more extreme level.
Tip: Having several RSI monitors set up at different time frames provides a more rounded view of market conditions.
Why is integrating the RSI with other technical tools important?
Using the RSI in conjunction with other indicators can help to make a more robust trading strategy, where each indicator works together to create a more refined and potentially accurate market view.
The basic approach of using 30 and 70 RSI levels as a signal that a market is oversold or overbought can be effective, but the RSI, like all indicators, performs better alongside other signals.
The RSI is an
Moving averages (MA) are other indicators that work well in conjunction with the RSI. A crossover of two moving averages that occurs simultaneously as the RSI reaches a key level, could signal a shift in momentum, indicating that a change in market direction is imminent.
Tip: The more indicators that signal a combined reading, the stronger the overall signal.
Using the RSI in successful trading scenarios
Investors using the RSI indicator in real-world trading scenarios could consider monitoring trendline breaks in their chosen market. In the price chart below, taken from the silver market, the downward trend in the RSI is broken just as a significant upward trend begins.
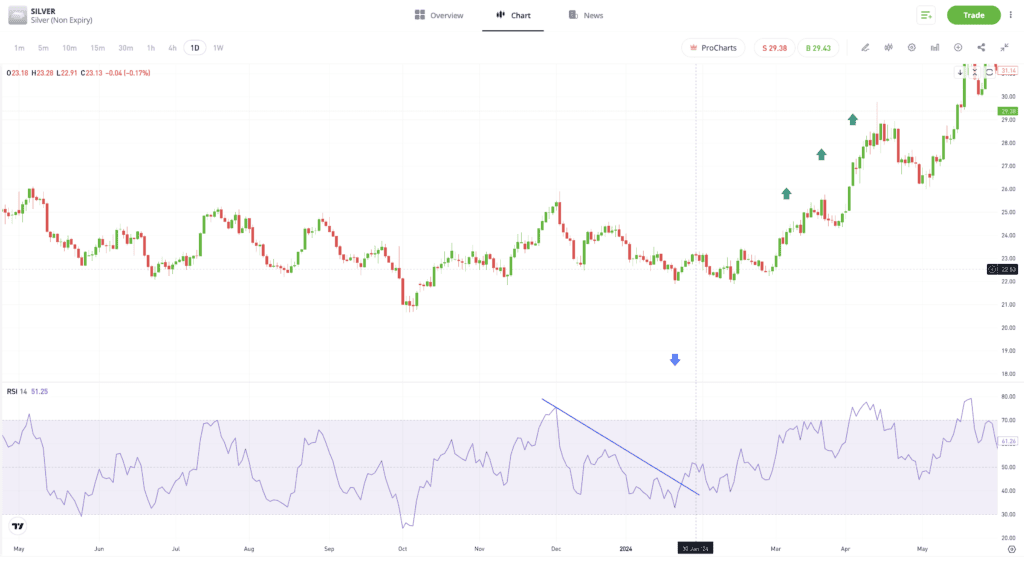
Past performance is not an indication of future results.
Source: eToro
The example below shows how a strategy based on RSI-price divergence helped to identify a particular moment when an upward trend ended and was followed by price weakness.
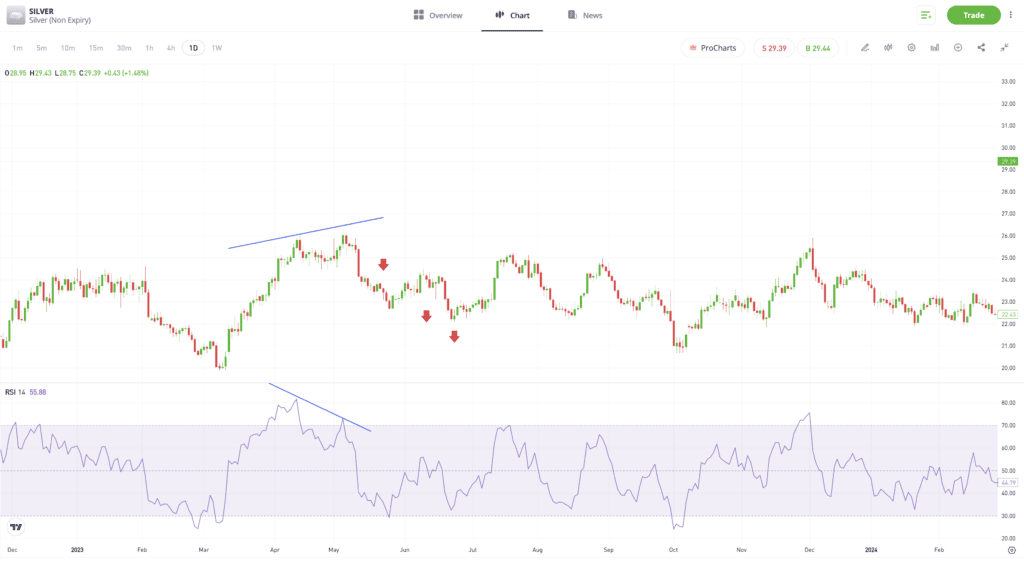
Past performance is not an indication of future results.
Source: eToro
How to customise the RSI for changing market conditions?
Traders can combat changing market conditions by using RSI metrics other than the basic 30–70 range. Euphoria and panic can trigger trends that make the basic approach to the RSI less effective. In these situations, the RSI can give a reading of above 70 or below 30 for a considerable time, and probably long enough for stop losses on any trades to be triggered and losses crystalised.
One way to avoid this potential pitfall is to set trading parameters to more extreme levels when price volatility increases. In the same manner, setting trade and entry points to be more conservative than the 30–70 range can help during periods when markets are quieter.

Final thoughts
Part of the reason for the popularity of the RSI is that it can be used as a stand-alone tool in a trading strategy, and as an additional indicator. However, incorporating more advanced ranges of the RSI can help to facilitate more accurate trading decisions — the indicator is used as the cornerstone for a variety of trading strategies.
Learn how to use multiple indicators on the eToro Academy.
Quiz
FAQs
- How can traders use the RSI to detect potential market divergences?
-
A trader can use the RSI to spot a price divergence when the metric records higher highs or lower lows that aren’t matched with the same pattern in another chart.
- What are the key considerations for adjusting RSI parameters to align with specific trading styles?
-
It is important to set the time frame parameters of the RSI monitor to match the time frame of your strategy. Traders running short-term, speculative strategies may find shorter RSI time frames, even as low as one minute, more useful.
- How can the RSI be used to enhance risk management in trading?
-
If you’re fortunate enough to be in a winning trade, then trade management should become your priority. A signal that the market has become overbought or oversold could be taken as a sign that stop losses need to be adjusted to ensure that you bank some of the unrealised gain and avoid a winning trade becoming a losing one.
This information is for educational purposes only and should not be taken as investment advice, personal recommendation, or an offer of, or solicitation to, buy or sell any financial instruments.
This material has been prepared without regard to any particular investment objectives or financial situation and has not been prepared in accordance with the legal and regulatory requirements to promote independent research.
Not all of the financial instruments and services referred to are offered by eToro and any references to past performance of a financial instrument, index, or a packaged investment product are not, and should not be taken as, a reliable indicator of future results. The availability of all the above-mentioned products and services may vary by jurisdiction and country.
eToro makes no representation and assumes no liability as to the accuracy or completeness of the content of this guide. Make sure you understand the risks involved in trading before committing any capital. Never risk more than you are prepared to lose.