


Develop your understanding of advanced technical indicators. Explore how to use them in real-world trading scenarios.
Developing ways to get more out of technical indicators can help you to optimise your trading returns. Once you have grasped the core principles of advanced technical analysis, you will find ways to use indicators to spot better trade entry and exit points and upgrade your trade management.

How to advance technical analysis with trading indicators
To advance technical analysis, traders should develop the indicators that may already be in their trading strategy and explore the indicators that aren’t currently being utilised.
There are countless indicators available to traders, each providing their own distinct insight into market conditions. Effective strategies incorporate some of the more subtle signals generated by indicators and, at the same time, combine signals from different types of indicators.

How to strategically apply indicators to market analysis
When strategically applying any indicator to market analysis, the common-sense approach is to start by considering its primary function. The Relative Strength Index (RSI), for example, is commonly used to identify moments when markets are
The time horizon of an investment approach also needs to be factored in. More rounded analysis involves establishing whether signals across different time frames support or oppose each other. Even short-term trading strategies, such as day trading, may benefit from using an indicator that shows support and resistance price levels specific to a weekly or monthly time frame. Shorter time frames, such as a 1 minute or 5-minute support/resistance levels, tend to hold less weight in trend analysis. Conversely, more obvious patterns found in charts with longer time frames, such as daily or monthly, are likely to hold more weight.
In addition, to expand the scope of a strategy, it is important to note that advanced analysis might lead you to consider trading different markets because the approach can be used to trade any type of asset class.
Indicators are extremely versatile tools in technical analysis because, when volatility levels in a market change, traders can either adjust the parameters of their indicators or move to trade a market that has better, more conducive conditions for their individual strategy.
Tip: Technical analysis indicators can be used in long-term and short-term investment strategies and to trade any market.
Combining indicators for enhanced strategies
The key to effective technical analysis is combining the signals produced by different indicators. The greater the number of indicators pointing in the same direction, the stronger the overall signal.
Advanced techniques also factor in the nature of those indicators. Momentum indicators, such as moving average convergence/divergence (MACD), offer an insight into the strength of trends, but not their direction. Static indicators, such as pivot points, provide a roadmap for price as it moves across a chart, rather than measuring the changes in market conditions.
Used in isolation, these two types of indicators might, or might not, generate a correct signal. Combining the readings of momentum and static indicators can help you to identify the times when there are signs that a significant price move might be about to occur, and also the price levels at which that move might take place.
Using momentum and static indicators simultaneously can help you to identify times when a significant price move may occur and the price levels from which the move may take place.
Tip: Use a demo account to test new strategies in a risk-free environment.
Real-world applications and case studies
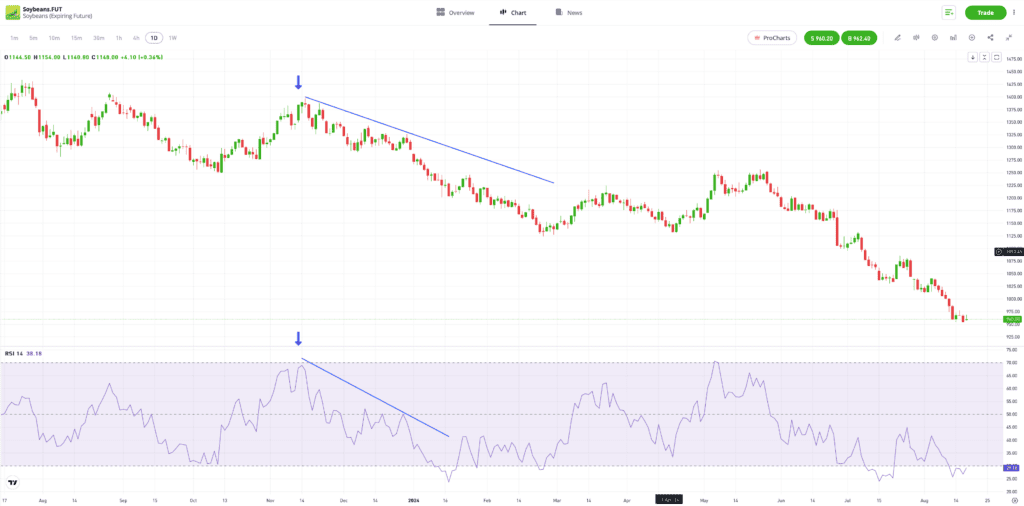
Past performance is not an indication of future results.
Source: eToro
In the price chart below, there is a divergence between price action and the RSI.
Using advanced technical analysis methods will not only help you to filter out incorrect signals, but can also reduce the total number of signals to trade — reducing the risk of overtrading. A more rounded approach will help you to double-check and cross-reference signals and incorporate valuable information from a variety of sources. This can potentially lead to fewer better-quality signals being generated.
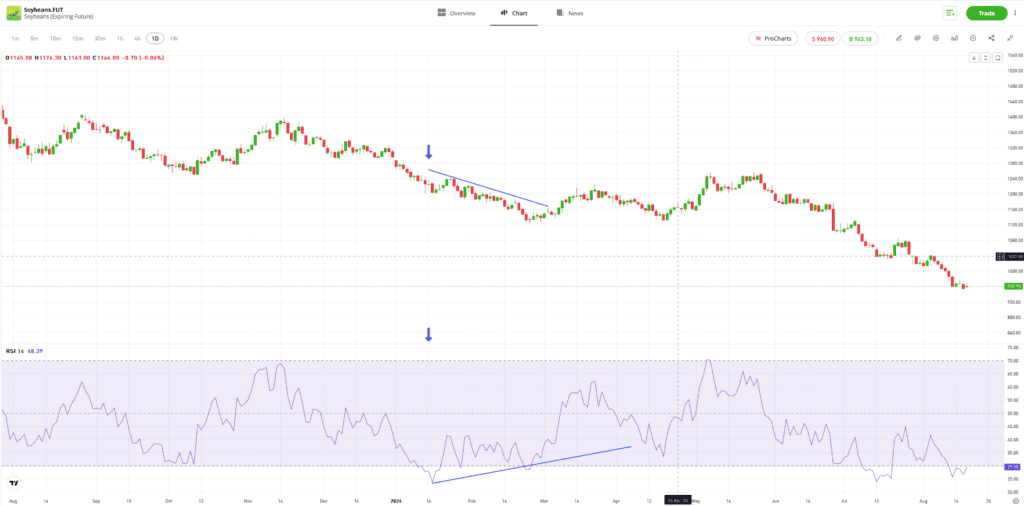
Past performance is not an indication of future results.
Source: eToro
Integrating indicators with trading platforms
All good brokers will offer trading platforms that support the most popular trading indicators. There is definite value to be gained by understanding how to adjust the default parameters and tailor an indicator to individual investment aims, or changes to market conditions.
It is also worth finding brokers that offer trading platforms specifically designed to support traders using technical analysis. Those can include powerful software tools and multi-screen functionality.

Final thoughts
Advancing a trading strategy with indicators involves utilising the potential of those indicators you are currently using and exploring the benefits of using new ones. The “obvious” signals they give off might be valuable, but taking a more nuanced approach can also be beneficial. If you then incorporate a range of different indicators into your analysis, you can potentially fine-tune your signal generation and develop a strategy that tilts the odds in your favour.
To learn more about trading with indicators, visit the eToro Academy.
Quiz
FAQs
- How do advanced trading indicators differ from basic ones?
-
Some indicators use a wider range of data sources than others, and some process data using a greater number of more complex formulae. This doesn’t necessarily mean that more complicated indicators are “better.” A more important factor to consider is which indicator would be more effective given the underlying market conditions.
- Can combining multiple advanced indicators improve trading accuracy?
-
Yes. One of the key elements of successful advanced technical analysis is developing ways to know which indicators work well together, and when to use them in conjunction. If two signals are giving off contrasting signals, then a trade you are about to enter might not be quite the opportunity you think it is.
- How do real-world case studies illustrate the effectiveness of these indicators?
-
The effectiveness of any indicator is easily measured. Simply open the price chart of any instrument, overlay a technical indicator of your choice, and work back through time to establish whether the signal would have worked. However, do be aware of the risk posed by changing market conditions, meaning that the accuracy of any indicator varies over time.
This information is for educational purposes only and should not be taken as investment advice, personal recommendation, or an offer of, or solicitation to, buy or sell any financial instruments.
This material has been prepared without regard to any particular investment objectives or financial situation and has not been prepared in accordance with the legal and regulatory requirements to promote independent research.
Not all of the financial instruments and services referred to are offered by eToro and any references to past performance of a financial instrument, index, or a packaged investment product are not, and should not be taken as, a reliable indicator of future results. The availability of all the above-mentioned products and services may vary by jurisdiction and country.
eToro makes no representation and assumes no liability as to the accuracy or completeness of the content of this guide. Make sure you understand the risks involved in trading before committing any capital. Never risk more than you are prepared to lose.