


Develop your understanding of Bollinger Bands by using practical examples. Learn how to incorporate this tool into your trend analysis.
Bollinger Bands are powerful and versatile tools that can help traders to more easily follow — and trade within — particular
What are Bollinger Bands?
Bollinger Bands are fundamental components of technical analysis strategies and work well in various markets to measure whether an instrument is overbought or oversold, as well as provide an indication of that asset’s price volatility. The lines are overlaid onto a price chart and their placement is determined by certain formulae that incorporate moving average (MA)
By including the calculations used in MAs, Bollinger Bands present an expected price range where any short-term divergence from the average might reverse. Basic Bollinger Band strategies using MAs often see traders selling short when a price reaches the top of the range. Conversely, basic strategies often buy into a price weakness when price reaches the bottom of the range.

How to use advanced trading techniques with Bollinger Bands?
There are various ways that Bollinger Bands can be used as part of more advanced technical analysis.
Consider the role of volatility
Traders often utilise Bollinger Bands to study certain periods when price moves away from a long-term average, but is expected to return and trade within the current range. However, it is important to acknowledge the width of the bands because this can indicate the levels of price
Different time frames and probabilities
Time frames are also an essential element in advanced Bollinger Band strategies. The settings on each line can be adjusted so that the bands provide signals that are relevant to the lifespan of trades. Typically, adjusting the bands to use higher time frames can provide stronger, more accurate signals. It is also possible to have several bands in place, each one marking the probable likelihood of price reversal.
Breakouts
Sometimes, however, Bollinger Bands can give a false signal and a price can break out of the range instead of reverting. Advanced trading can work to flip this issue on its head, and traders can use Bollinger Bands to spot when a new trend is forming.
Tip: Widening Bollinger Bands signal that price is moving away from the long-term average range, and that a breakout may occur.
Integrating Bollinger Bands with other technical indicators
Bollinger Bands work particularly well with momentum indicators such as moving average convergence/divergence (MACD) and the Relative Strength Index (RSI). These indicators provide an insight into the strength of a trend, rather than its direction.
When price moves to touch a Bollinger Band, momentum indicators offer a guide as to whether price might continue to diverge from the long-term average. If momentum is high, a breakout could be about to occur. If it is weak, there is a greater chance that the Bollinger Band range will hold.

Real-world trading scenarios using Bollinger Bands
Bollinger Bands can be very popular strategies to use in real-world trading scenarios as they offer ideas on where to enter trades, set stop-losses, and offer clues on when to close out trades.
In the price chart below, taken from the Eurodollar, there is a period of sideways trading during which price moves within the range set by the Bollinger Bands. The bands are also relatively narrow, signalling a period of low volatility. Here, trades based on price reverting at the edge of the Bollinger Band range would have been successful.
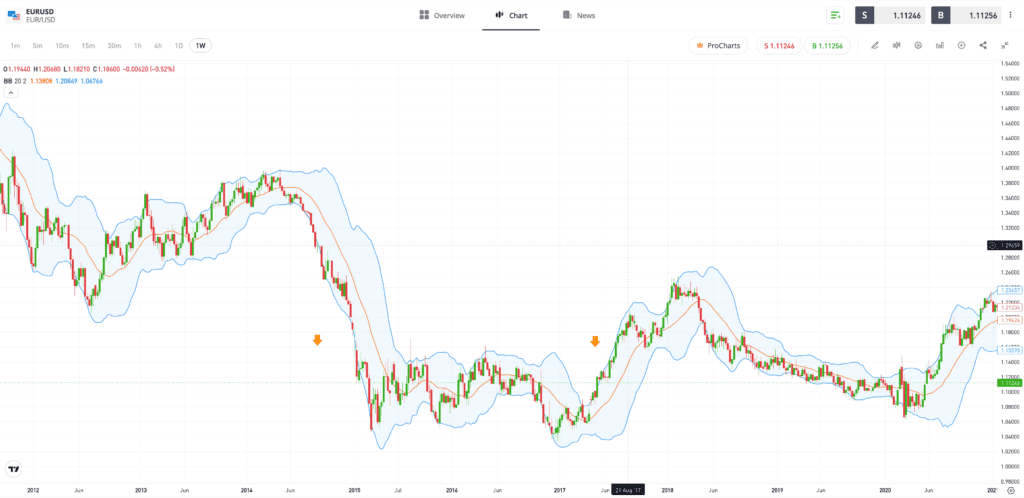
Past performance is not an indication of future results.
Source: eToro
The price chart below from the same currency market marks a period of sustained pressure on the lower Bollinger Band, and a widening of the band. This marks a breakout from the previous range and the formation of a downward trend.
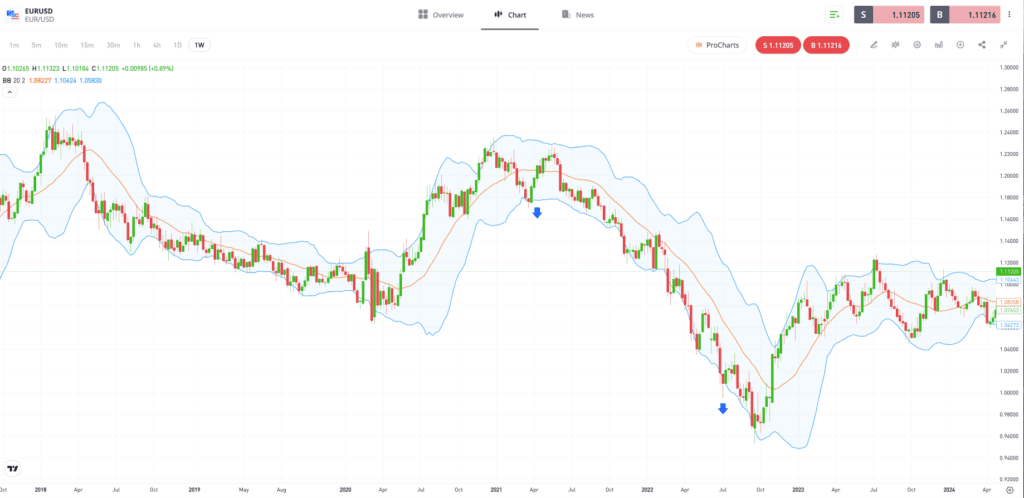
Past performance is not an indication of future results.
Source: eToro
Tailoring Bollinger Bands to a trading style
Bollinger Bands are versatile tools that can be used in various strategies. Traders interested in short-term, speculative buying and selling may choose to look for trade entry and exit points that are based on the bands holding. This approach aims to generate returns by trading the everyday price moves seen in all markets.
Investors with a long-term trading plan can use Bollinger Bands to help identify breakouts that, in turn, can mark significant shifts in market sentiment when new trends are forming.

Final thoughts
Bollinger Bands offer an insight into two key market factors: trend and volatility. The fact that they cover two key factors makes them powerful and useful tools, but Bollinger Bands are best used with momentum indicators that offer a second opinion on the all-important question of whether the bands will hold or not.
To learn more about Bollinger Bands, visit the eToro Academy.
Quiz
FAQs
- How can traders identify and interpret Bollinger Band squeeze scenarios?
-
Bollinger Band squeeze setups are marked by Bollinger Bands narrowing and remaining narrow for an extended period of time. The strategy identifies moments when volatility drops, reflecting market uncertainty and the potential for a breakout to occur and a new trend to form.
- What are the common pitfalls to avoid when using Bollinger Bands in trading analysis?
-
The big decision for traders using Bollinger Band strategies is whether the moment that price reaches an outer band signals a point when it will revert to the mean or continue diverging and form a new trend. Momentum indicators, which can be used in conjunction with Bollinger Bands, will give an indication of the strength of market momentum.
- How can Bollinger Bands be applied in conjunction with fundamental analysis?
-
A trader or investor who has used fundamental analysis to establish if an asset is over or undervalued could interpret the moment that Bollinger Bands widen as the point at which the rest of the market has caught up with their analysis ideas.
This information is for educational purposes only and should not be taken as investment advice, personal recommendation, or an offer of, or solicitation to, buy or sell any financial instruments.
This material has been prepared without regard to any particular investment objectives or financial situation and has not been prepared in accordance with the legal and regulatory requirements to promote independent research.
Not all of the financial instruments and services referred to are offered by eToro and any references to past performance of a financial instrument, index, or a packaged investment product are not, and should not be taken as, a reliable indicator of future results. The availability of all the above-mentioned products and services may vary by jurisdiction and country.
eToro makes no representation and assumes no liability as to the accuracy or completeness of the content of this guide. Make sure you understand the risks involved in trading before committing any capital. Never risk more than you are prepared to lose.