


The Daily Breakdown looks to close out our three-day mini course on technical analysis, helping investors tie together the major themes. Don’t Miss: Part I: Welcome to Technical Analysis and Part II: How to Use Moving Averages.
Before we dive in, let’s make sure you’re set to receive The Daily Breakdown each morning. To keep getting our daily insights, all you need to do is log in to your eToro account.
Boot Camp: Putting It Together
Over the past two days, we have covered the two most foundational tools in technical analysis: support and resistance (where buyers and sellers have historically shown up) and moving averages (a simple way to identify trend and reduce noise). Day 3 is about combining them into a repeatable framework. The goal is not to predict what will happen next — it is to put the odds in your favor by understanding (1) the market’s trend and (2) the price levels that matter.
Step 1: Start With Trend (Your Filter)
Before focusing on individual levels, define the environment. Moving averages help do that quickly.
- Bullish trend: Price is above a rising intermediate/long-term moving average (often the 50-day; longer-term investors also watch the 200-day). In this environment, you generally want to favor long setups and be more selective with shorting.
- Bearish trend: Price is below a falling moving average. Here, you generally want to favor short/defensive setups and be more cautious about buying dips.
- Range-bound or “chop”: The moving average is flat and price repeatedly crosses it. This is typically a lower edge environment — levels matter more than trend-following.
Think of the moving average as your “wind direction.” It does not tell you exactly when to act, but it helps you avoid fighting the dominant force.
Step 2: Mark the Key Levels (Your Map)
Identify the obvious support and resistance zones on the chart. These zones are where decisions get made. They also help you avoid a common beginner trap: taking trades in the middle of nowhere. Lastly, a break of these zones can help determine the stock or asset’s next direction.
Want to receive these insights straight to your inbox?
Step 3: Look for Confluence (Where the Best Setups Live)
The highest-quality technical setups often come when a key moving average and a support/resistance zone overlap. This is called confluence — two different tools highlighting the same area. Confluence matters because it increases the odds that other market participants are paying attention to the same spot, which can intensify the reaction.
Examples of confluence:
- Price pulls back to a prior breakout level and the 20-day or 50-day moving average is rising into that zone.
- Price rallies into former support turned resistance and a declining moving average is sitting overhead.
- Price tests the 200-day moving average at the same time it reaches a multi-month support zone.
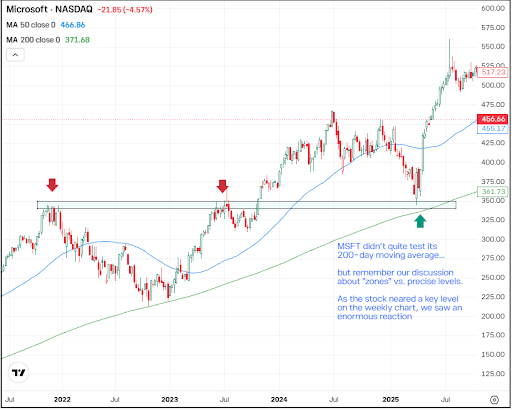
In the example below, notice how the moving averages highlight the longer term trend on Microsoft stock. Then notice how a key moving average — the 200-week — aligns near a major prior resistance area. This “role reversal” came into play at a critical confluence zone as bulls bought the dip into this area.
The Bottom Line
Investors can use fundamental analysis to determine what to buy and technical analysis to help decide when to buy (or when to throw in the towel). Support and resistance show you where price decisions have historically been made, while moving averages help you understand whether you are in a trending or choppy environment.
When you combine them, you get a practical framework: trade in the direction of the trend, focus on high-quality locations near key levels, and use moving averages as dynamic support/resistance and as a risk-management guide. No tool is perfect, but a simple, repeatable process can keep you aligned with the market — and, just as importantly, keep you out of low-odds trades. This is the difference between “having indicators” and having a process.
Disclaimer:
Please note that due to market volatility, some of the prices may have already been reached and scenarios played out.