


Technical analysis has become a key concept from market participants. The Daily Breakdown is here to help investigate navigate this terrain. Don’t forget, there’s Part II: How to Use Moving Averages and Part III: Building a Process.
Before we dive in, let’s make sure you’re set to receive The Daily Breakdown each morning. To keep getting our daily insights, all you need to do is log in to your eToro account.
Boot Camp: Support & Resistance
Last year we covered fundamental analysis, and this year, we’re going to kick off 2026 with a three-day intro to technical analysis. Today we’ll get down to the basics: Support and resistance.
For as many algorithms and gizmos available today, some of the most tried and true forms of technical analysis showcase simplicity at their core. Ultimately, technical analysis is about understanding how buyers and sellers behave at certain prices or levels. Support and resistance are the most basic — and arguably the most important — tools for doing that.
- Support is an area where buyers have historically stepped in.
- Resistance is an area where sellers have historically taken control.
Lines vs. Zones (A Common Beginner Mistake)
One of the most common mistakes new traders make is drawing perfectly precise lines. In reality, support and resistance may be better viewed as zones. Remember, markets are not always perfect or exact.
Example: Imagine a stock that has bounced multiple times between $98 and $100. Instead of drawing a single line at $99.37, it may be more useful to mark a $98 to $100 support zone.
Role Reversal
One of the most powerful concepts in technical analysis is role reversal. This is a key concept, not just because it could mark a notable shift in the trade setup, but because it’s often used as a form of risk management.
- A former support level, once broken, can become resistance.
- A former resistance level, once reclaimed, can become support.
Example: If a stock trades sideways below $50 for months and repeatedly fails there, $50 becomes resistance. If price later breaks above $50 and holds, that same level often acts as support on pullbacks — its role has reversed.
Want to receive these insights straight to your inbox?
Some Examples
We’re leaning on the Magnificent 7 for some examples with Nvidia, Microsoft, and Alphabet.
Nvidia
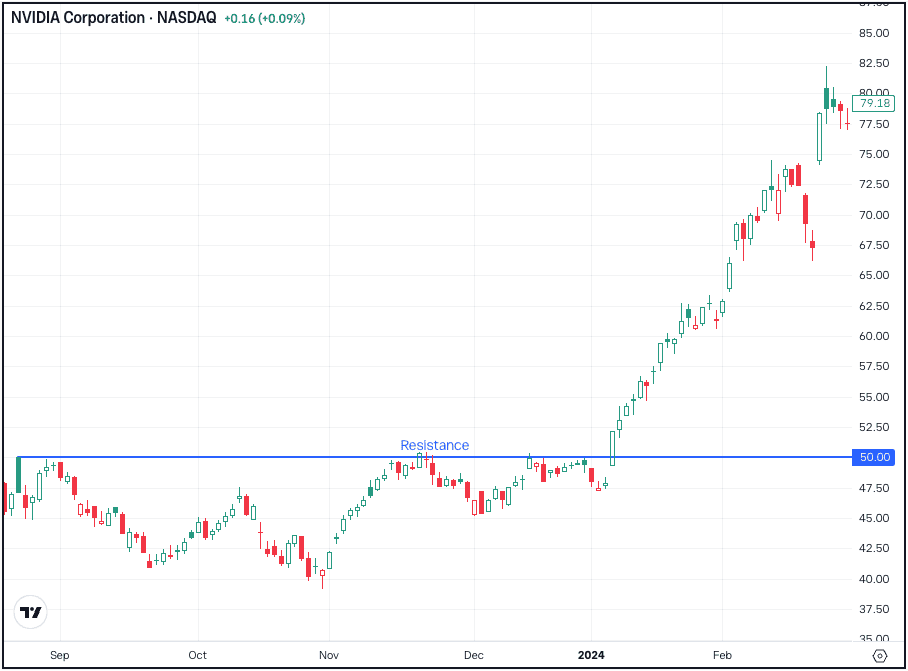
After rallying more than 300% from its October 2022 low to its highs in August 2023, Nvidia began a multi-month consolidation phase, with $50 acting as resistance. Nvidia eventually broke out over this level before gaining even more momentum. This is a good example of a clean breakout, with shares surging over resistance and never retesting these levels again.
Microsoft
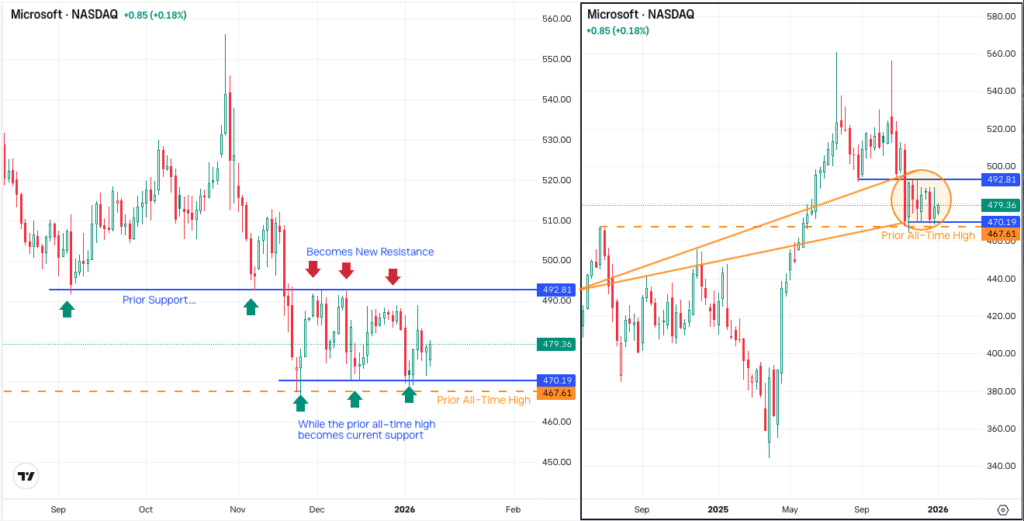
With Microsoft, notice on the daily chart (left) how the stock was finding support in the low-$490s before it failed. However, after support failed, this level turned into resistance. This type of development — or “role reversal” — is actually pretty common.
Now utilizing the weekly chart on the right, notice how the stock’s old all-time high from summer 2024 is now acting as support in the upper $460s.
Alphabet
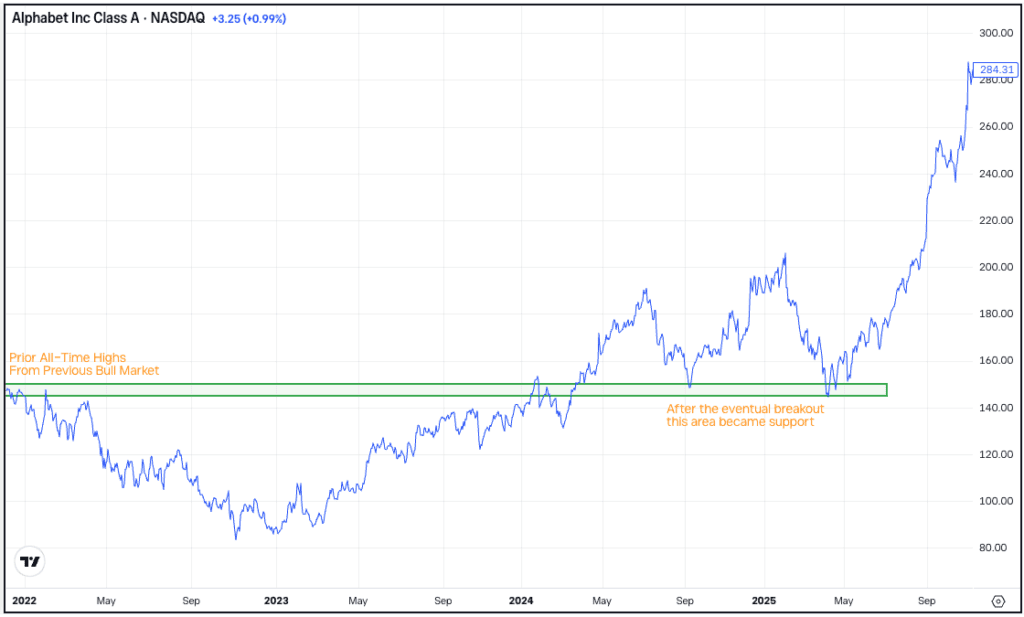
Alphabet is a great example of two things: A breakout over prior resistance that turns into current support, and the fact that this analysis can apply broadly over multiple timeframes — anything from the weekly chart down to a 30-minute chart.
On the weekly chart above, notice how prior resistance in the $140 to $150 area — which marked Alphabet’s record highs from the prior bull market — became a key breakout area in April 2024. But then notice how this zone was support on ensuing pullbacks.
The Bottom Line
While fundamental analysis might help determine what to buy, investors who infuse technical analysis into their market evaluations can help use it to determine when to get in and — perhaps more notably — when to get out of their positions. Support and resistance are the building blocks of technical analysis, but remember: just because a zone breaks or holds at one point does not mean it will continue to do so in the future.
Next: Part II: How to Use Moving Averages
Disclaimer:
Please note that due to market volatility, some of the prices may have already been reached and scenarios played out.