


The Daily Breakdown takes a closer look at stock market seasonality, with November historically being the best month of the year.
Before we dive in, let’s make sure you’re set to receive The Daily Breakdown each morning. To keep getting our daily insights, all you need to do is log in to your eToro account.
Deep Dive
When it comes to seasonality, investors often focus on September — historically the market’s weakest month. Yet this year, it barely made a dent, as the S&P 500 and Nasdaq 100 extended multi-month win streaks right through “Spooky September.” Ironically, as we enter the strongest stretch of the year, markets are now sliding.
The SPY ETF is down 5.3% from its high, while the QQQ is off 8.5%, including a 2.4% drop on Thursday despite Nvidia’s solid earnings. It doesn’t help that bitcoin has fallen more than 30% from record highs as crypto continues to reel from its October 10th selloff.
The Best Month of the Year
Looking back over the past 25 and 50 years, November stands out as the strongest month for equities, averaging returns above 2% — a feat no other month matches for either timeframe. However, as of Thursday’s close, the S&P 500 is down over 4% for November. Historically, November and December have been the market’s best back-to-back months, and November also kicks off what’s considered the strongest six-month stretch of the year (November through April).
The Bottom Line
This historically bullish period is off to a rough start, though the S&P 500 remains up roughly 12% year to date. Investors can debate the causes — from crypto’s decline and the government shutdown to the legal standing of tariffs, labor market weakness, the Fed’s path on rates, or fears of an AI bubble. The reality is it’s likely a combination of all of them.
As uncertainty rises, so does volatility, making investors hesitant to pay the premium valuations we saw at the end of Q3. Still, history shows the S&P 500 typically sees three 5% dips a year, and 10%+ pullbacks do happen. While more selling pressure could ensue, these types of corrections often refresh, rather than derail, a bull market.
Want to receive these insights straight to your inbox?
The Setup — SPY ETF
The SPY is down about 5% from its all-time highs right now. Shares tried to rally on Thursday and were up almost 2% at one point, but ultimately, SPY failed to regain its 50-day moving average and turned lower on the session. Now bulls are hoping it can find support near the $650 level, just as it has done since mid-September.
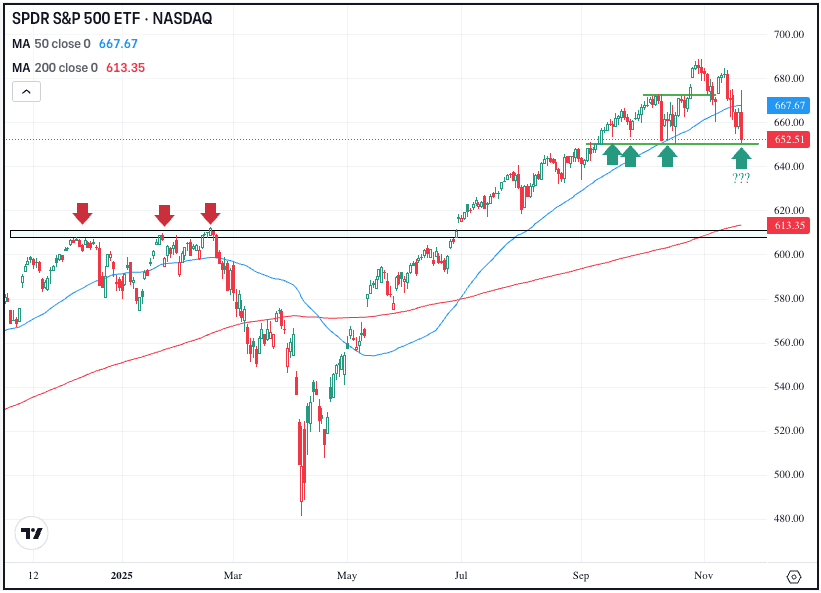
If this area acts as support, bulls will look for a rebound. However, it will need to clear the $675 area and the 50-day moving average in order for bulls to fully regain confidence. If the $650 area ultimately fails as support, it could open the door to a larger correction — potentially down to the 200-day moving average and the prior all-time highs near $610, which was a major breakout level in July.
Options
It’s worth noting that today is the monthly options expiration. Will some of those favorable seasonality stats kick in after this expiration or will the selling pressure continue?
Investors who are bullish could consider calls or call spreads as one way to speculate on further upside, while bearish investors could consider puts or put spreads to speculate on a further move to the downside. For options traders, it may be advantageous to have adequate time until the option’s expiration.
To learn more about options, consider visiting the eToro Academy.
Disclaimer:
Please note that due to market volatility, some of the prices may have already been reached and scenarios played out.