


Develop your understanding of Fibonacci levels using practical examples. Learn how to use real-world strategies as part of advanced technical analysis.
Fibonacci (Fib) levels offer effective trade entry and exit points for those using technical analysis to further their trading knowledge. However, strategies using Fibonacci’s golden ratio can be more powerful than straightforward Fib

What are the fundamentals of Fibonacci retracement?
Fibonacci retracement levels are based on a simple mathematical sequence where two previous numbers are added together to create the following number in the sequence. Despite the simplicity of this formula, Fibonacci retracement levels have a proven track record of being a point at which the prices of financial assets find support or meet resistance.
Tip: The Fibonacci number series begins with zero and one, and extends infinitely: 0, 1, 1, 2, 3, 5, 8, 13.
To some extent, however, understanding the mathematics behind the Fibonacci levels is less important than appreciating how traders use them. In keeping with the Fibonacci formula, common levels traders consider include 23.6%, 38.2%, 61.8% and 78.6%.
In any market that is experiencing a retracement in price, countless traders will be waiting for the price to bounce off these commonly considered markers. Therefore, in some ways, Fibonacci levels can be viewed as a self-fulfilling prophecy.
Tip: The 50% or half-way retracement level isn’t actually a Fibonacci number, but is often incorporated into Fib analysis indicators.

What are advanced techniques in Fibonacci integration?
Advanced traders can integrate Fibonacci numbers into other trading techniques by using the core sequence of numbers to determine a range of other price support and resistance levels, not just retracement levels.
These include:
- Fibonacci Extension: Calculated by extending the retracement levels beyond the 100% price mark, rather than back from it.
- Fibonacci Arcs: Half-circles that extend away from high and low price points. The radius of the arc is determined by the Fibonacci sequence.
- Fibonacci Fans: A series of trendlines that are determined by the Fibonacci ratio and that extend from a price high or low.
- Fibonacci Time Zones: These vertical lines are set using the standard Fib levels and extend to the right of the chart. Usually based on a previous swing low or swing high, they indicate how much time will likely pass before the next swing high, swing low or retracement might take place.

Case studies of successful Fibonacci strategies
Retracements are the primary way in which Fibonacci levels are used, and these fairly straightforward price point signals can potentially become more successful when incorporating other types of indicators into your strategy. The supporting indicator, whether it is the Relative Strength Index (RSI) or a moving average convergence/divergence (MACD), for example, can be monitored and assessed as the market price approaches any Fibonacci support and resistance levels.
The example below displays the Daily Price Chart of the Ether market, using RSI as the supporting indicator. At the point at which the price of ETH fell back to the 50% retracement level, the RSI printed a new six-month low and indicated that the market was
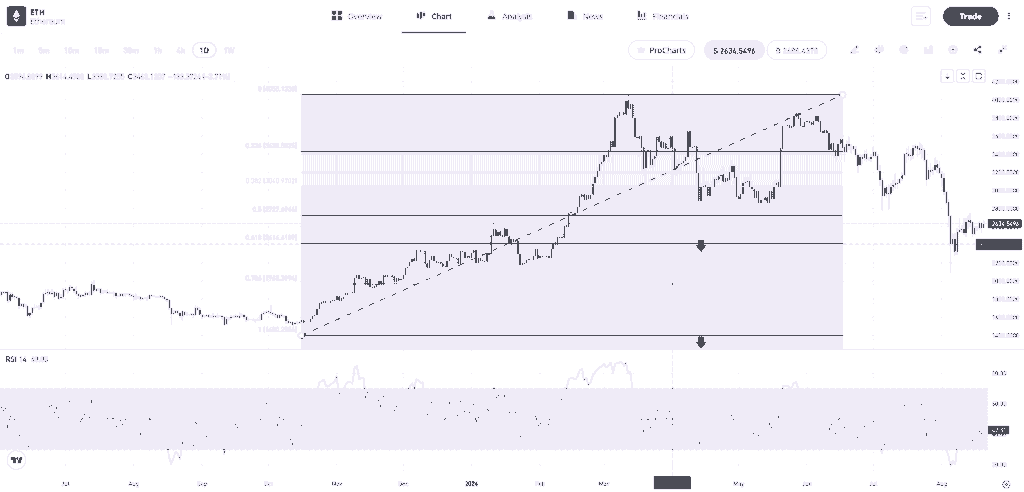
Past performance is not an indication of future results.
Source: eToro
How to optimise trading decisions with Fibonacci?
Traders can optimise their investment strategies by adopting Fibonacci levels as part of trade management protocols. The levels provide convenient targets for trade entry and exit points, but their use also extends to risk management.
Tip: Fibonacci levels can also be used to cut losses or to take profit orders.
In the example below, taken from the silver market, a successful short-sale position would have generated a positive
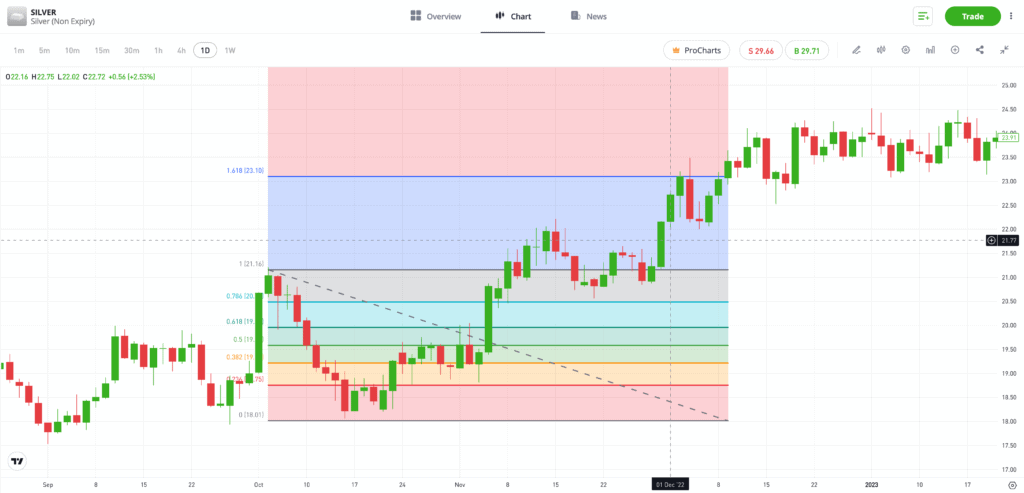
Past performance is not an indication of future results.
Source: eToro
Applying Fibonacci in various market scenarios
There are various ways to apply Fibonacci levels to real-world trading scenarios. Whether you’re using retracement, extension or another Fib tool, the common factor used is a base swing high, or swing low.
Fibonacci Time Zone
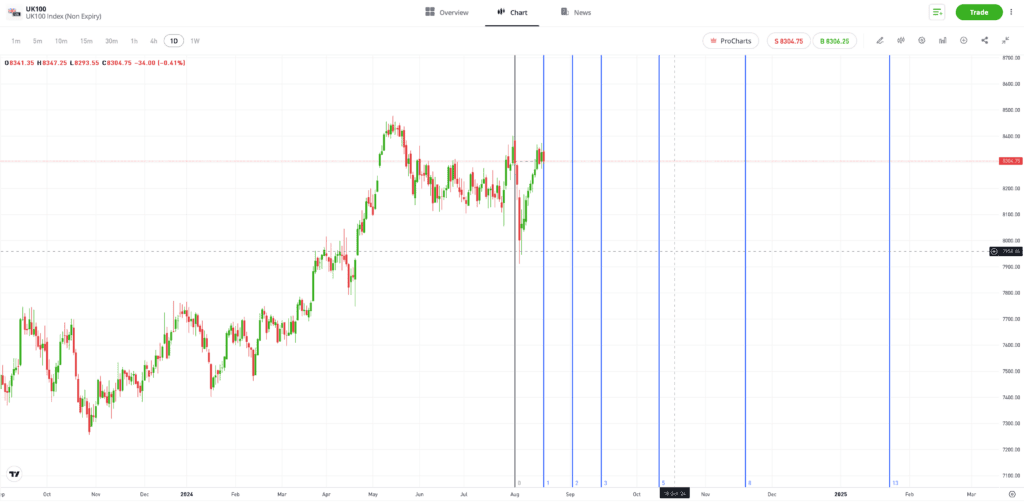
Past performance is not an indication of future results.
Source: eToro
The Fibonacci Time Zone tool uses time frames to consider previous levels of price volatility. The Trend-Based Fib Extension uses three points instead of two, allowing the analysis of existing trends and posing a question as to whether or not they are likely to continue. Like all indicators, the signals taken from longer time frames will likely hold more weight than those from shorter time frames.
Trend-based Fib Extension
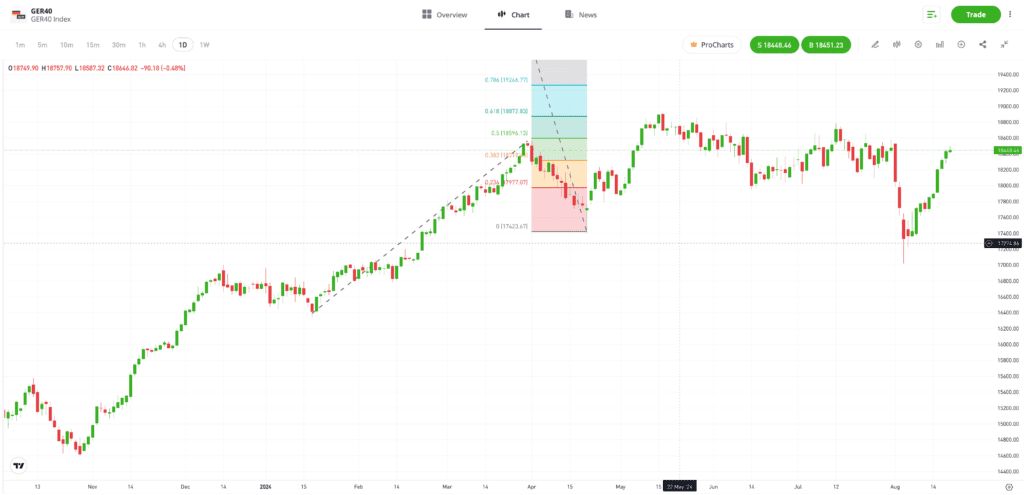
Past performance is not an indication of future results.
Source: eToro
Final thoughts
Fibonacci levels are well-established elements of technical analysis. Their extent to which other traders use them means it makes sense for active traders to understand and identify them. Using some of the more advanced techniques can help you to develop your strategy planning, potentially optimise returns, manage risk and help determine whether to close out a trade or let it run.
Explore various trading indicators with the eToro Academy.
Quiz
FAQs
- How can traders ensure the accuracy of Fibonacci retracement levels in their analysis?
-
The software package of any trading platform will do the number-crunching for you, and applying any of the Fibonacci tools to a price chart is done using a click-and-drop method. It is important that the points you click on are appropriate for your analysis, but good platforms will allow you to adjust their position until you are confident that they are placed correctly.
- What are the common pitfalls to avoid when integrating Fibonacci with other indicators?
-
One of the biggest issues for Fib level traders is the existence of other Fib levels. If you are day trading and focused on identifying trading points using a short-term price chart, you might miss a more significant Fib level derived from a daily price chart that could be in the range of your trading environment.
- How can Fibonacci retracement be adapted to different market conditions for optimal results?
-
Fibonacci retracement techniques work better in “quieter” markets. It could be argued that their effectiveness relies on psychological factors and a consensus that they “just work”. During times when markets are stressed, fear and greed can become the emotions more likely to guide price.
This information is for educational purposes only and should not be taken as investment advice, personal recommendation, or an offer of, or solicitation to, buy or sell any financial instruments.
This material has been prepared without regard to any particular investment objectives or financial situation and has not been prepared in accordance with the legal and regulatory requirements to promote independent research.
Not all of the financial instruments and services referred to are offered by eToro and any references to past performance of a financial instrument, index, or a packaged investment product are not, and should not be taken as, a reliable indicator of future results. The availability of all the above-mentioned products and services may vary by jurisdiction and country.
eToro makes no representation and assumes no liability as to the accuracy or completeness of the content of this guide. Make sure you understand the risks involved in trading before committing any capital. Never risk more than you are prepared to lose.