


Develop your understanding of Japanese candlesticks and learn how to read patterns accurately. Use practical examples to help enhance strategy and technical analysis.
Japanese candlesticks offer a user-friendly visual representation of the pricing conditions found in any financial market. Traders can use the tool to track price moves and understand the core factors behind them. Japanese candlesticks also offer a way for traders to take advantage of more advanced aspects of technical analysis.

How to decode Japanese candlesticks?
The form of a Japanese candlestick can give an immediate idea as to whether a market is bullish or
The body of the candle is red when representing a bearish signal, wherein the closing price is lower than the opening price. The long upper wick suggests that, during that trading period, a degree of buying pressure was present in the market, but that the bullish sentiment was beaten back by bearish traders who were dominant when the interval closed.
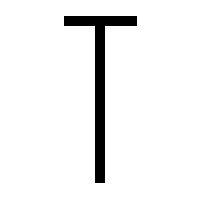
An inverted hammer candlestick typically indicates that a further downward price movement can be expected, unless there is reason to believe that the fundamental situation within the market has changed.
Inverted Hammer Candlestick — Bearish

Tip: Candlestick bodies are typically coloured green or white (bullish) and red or black (bearish).
Why is interpreting advanced candlestick patterns important?
By interpreting advanced candlestick patterns, traders can instantly recognise patterns that can help them to spot trading opportunities more quickly. Advanced candlestick analysis involves becoming more familiar with the meanings behind individual candlestick patterns. However, it is also beneficial to consider the patterns formed by a sequence of more than one candlestick.
Here are four commonly used candlesticks and their signals.
Doji — Uncertainty/
continuation
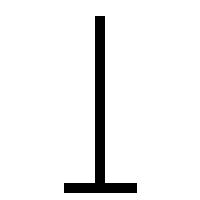
Dragonfly doji — Bullish
Hammer — Bullish
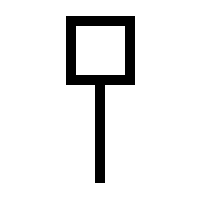
Gravestone doji — Bearish

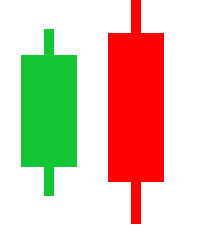
When a second engulfing candle has a body size larger than the other, the pattern illustrates that the price range is more extensive than the previous one. The candles in this pattern also need to be different colours as this indicates that a reversal is taking place.
However, with bullish engulfing candles, a bearish candle (closing share price is lower than the opening share price in the chosen time frame) is followed by a second candle that depicts a bullish signal (closing share price is higher than the opening share price of the original bearish candle in the chosen time frame).
Bullish Engulfing
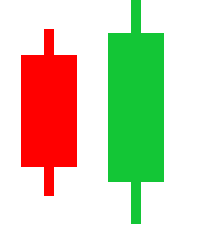
Bearish Engulfing
Integrating candlestick patterns with technical analysis
Integrating candlestick patterns with other advanced trading strategies can offer an immediate idea of how price moves over time. This can help traders to identify individual trading opportunities. It is important to remember that signals shown on a higher time frame generally hold more weight than those on a shorter time frame.
Advanced traders can incorporate candlestick patterns with strategies based on support or resistance price levels. As price moves towards a support or resistance level, an engulfing candle would give a confirmatory signal that price is indeed beginning to reverse.

Applying candlestick patterns to real-world trading
Applying Japanese candlesticks to real-world strategies, such as those that incorporate Bollinger Bands, moving averages and Fibonacci indicators, can help to establish whether the potential point of support or resistance is the point at which there will be a real-time change in the behaviour of buyers and sellers.
The chart below depicts a long-term bullish
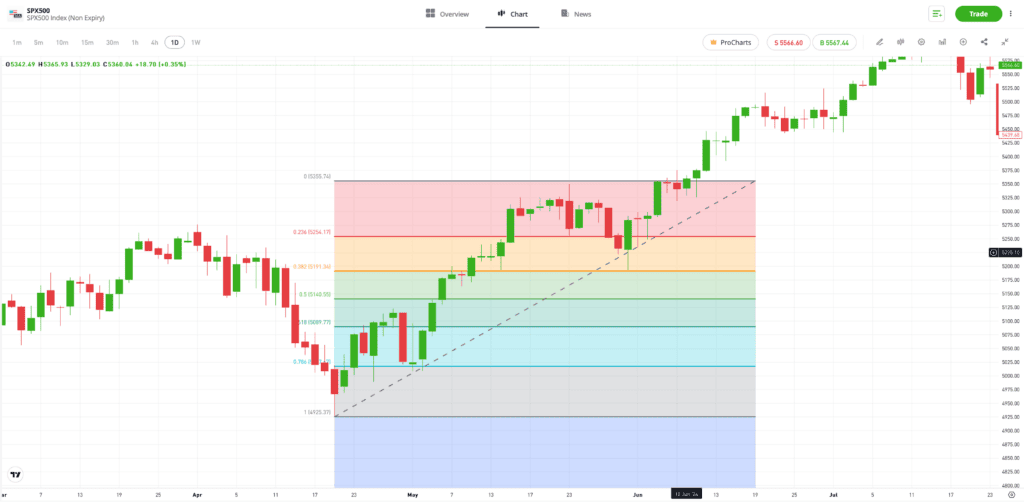
Past performance is not an indication of future results.
Source: eToro
How to enhance predictive accuracy with candlesticks
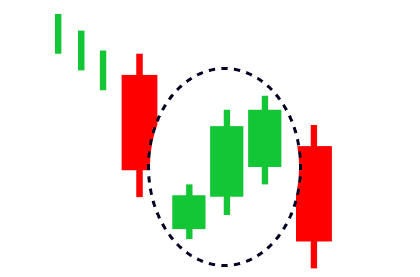
Traders can utilise Japanese candlesticks to more accurately decipher upcoming reversals and trend continuations. For example, the falling three and rising three candlestick patterns map out how an underlying trend will inevitably go through periods of reversal. However, if the falling or rising three patterns hold, then the trend can be expected to resume moving in the same direction.
Tip: Adjust the time frame on your price chart to reveal a variety of candlestick patterns.
Falling Three — Bearish
Rising Three — Bullish
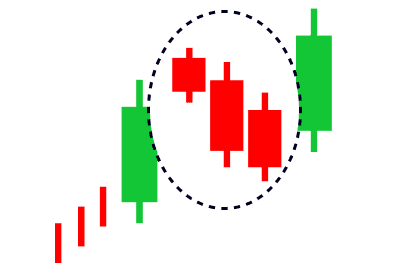
Rising and falling three patterns require the three retracement candles to remain within the body of the two candles on either side of them. This indicates that the traders attempting to go against the trend have failed to build enough momentum to bring about a sustained reversal.

Final thoughts
Japanese candlesticks work on simple principles that can be incorporated into advanced trading strategies. Accurately reading candlesticks provides a way to immediately view real-time market conditions, an ideal skill to use in conjunction with other indicators.
Learn how to incorporate strategies with candlestick patterns on the eToro Academy.
Quiz
FAQs
- What are some advanced candlestick patterns that traders should know?
-
There are numerous advanced candlestick patterns that are popular among traders, including the morning star and evening star indicators that depict a potential upcoming reversal. The three black crows pattern points to a downward trend continuing, whereas the three white soldiers pattern points to a bullish trend continuing to raise prices.
- How can traders differentiate between similar-looking candlestick patterns and their implications?
-
Traders can identify candlestick patterns by the size of the body, the length of the wick and the colour of the body. Focusing on these elements can help you to determine which charting pattern has been formed.
- What are the best practices for integrating candlestick patterns with other technical analysis tools?
-
Candlestick patterns track real-time market sentiment, which makes them useful tools when monitoring the price of an asset as it approaches static price level indicators. At the point that price touches the static indicator, you can assess whether the candlestick pattern supports your analysis.
This information is for educational purposes only and should not be taken as investment advice, personal recommendation, or an offer of, or solicitation to, buy or sell any financial instruments.
This material has been prepared without regard to any particular investment objectives or financial situation and has not been prepared in accordance with the legal and regulatory requirements to promote independent research.
Not all of the financial instruments and services referred to are offered by eToro and any references to past performance of a financial instrument, index, or a packaged investment product are not, and should not be taken as, a reliable indicator of future results. The availability of all the above-mentioned products and services may vary by jurisdiction and country.
eToro makes no representation and assumes no liability as to the accuracy or completeness of the content of this guide. Make sure you understand the risks involved in trading before committing any capital. Never risk more than you are prepared to lose.