


Develop your understanding of MACD indicators using practical examples. Learn how to use the indicators as part of advanced technical analysis.
The moving average convergence/divergence (MACD)

Understanding MACD: Beyond the basics
Understanding how to optimise the MACD, one of the most widely used technical indicators in the market, can help to advance a basic trading strategy.
More advanced implementation of the MACD involves adjusting the parameters of the source data, incorporating additional features such as signal lines, or viewing the indicator using different visual displays. Adjusting the way that the indicator is set up allows the elements of the formulae to be used more extensively when identifying or double-checking trading signals.
Tip: MACD spots trends and measures momentum, but other indicators are required to establish the direction of the trend.
How to use MACD to advance trading strategies
Investors looking to advance their strategies can interpret the MACD as a
- MACD Signal Line — Introducing a shorter dated
EMA and overlaying that line into the MACD monitor can make it easier to spot times when the MACD turns. A bullish crossover occurs when the MACD turns up and crosses above the signal line, while a bearish crossover takes place when the MACD crosses the signal to the downside. - MACD Histogram — A histogram subtracts the value of the signal line from the core MACD reading. Using a histogram is often easier than comparing the gradient of two lines. When the histogram is above zero, the MACD is higher than the signal line, and vice versa.
- MACD Crossover — The point at which the MACD crosses the signal line is called a crossover.
- MACD Divergence — “Divergence” is the term given to the point at which price chart movements disconnect from movements on the MACD monitor. A pattern that displays higher swing highs on a price chart but lower swing highs on the MACD monitor is typically considered a bearish divergence, and potentially points to future price weakness.
Tip: MACD turns two MAs into a momentum oscillator by subtracting the longer dated moving average from the shorter dated one.
How to integrate MACD with other technical indicators
Traders can integrate the MACD with other indicators to create a well-rounded trading strategy, rather than using the MACD as a stand-alone tool. As a momentum indicator, the MACD benefits from accompanying indicators that outline the direction of trends or mark points where trends have ended. These include trendlines, support and resistance levels, and other charting techniques. The MACD also works well in tandem with the Relative Strength Index (RSI), which pinpoints when markets are over and undersold, and Bollinger Bands, which mark points on a chart where trends might revert.

Using MACD in real-world trading scenarios
MACD crossovers and inversions are particularly useful tools in real-world trading scenarios as they can help traders to spot moments when trends are about to end and reverse. However, without these indications, there are a lot of good reasons to follow the established wisdom of trading in the same direction as the trend.
In the price chart below of the S&P 500 Index, a higher high on the price chart is challenged by a lower high on the MACD chart. This divergence signals upcoming price weakness and a chance to enter short positions. While price weakness does not immediately form, it does eventually take the price of the index to below the trade entry point.
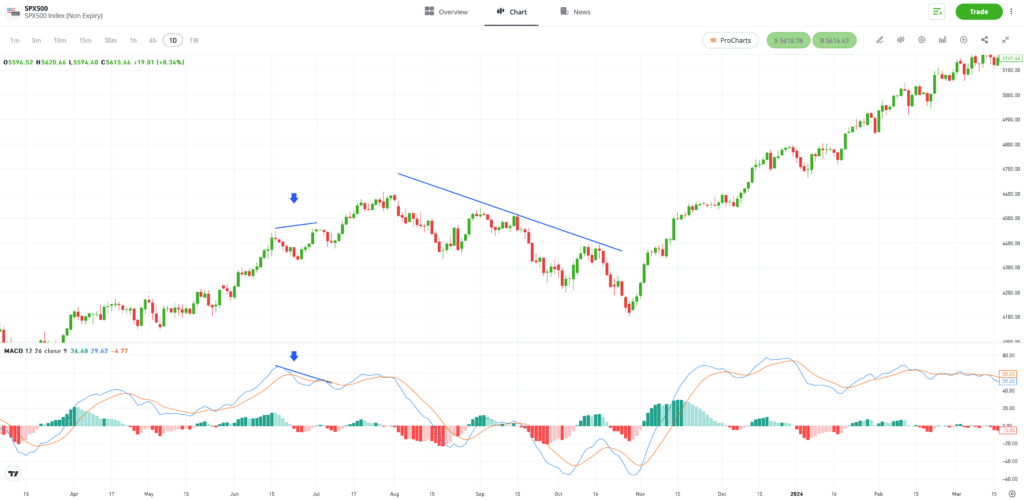
Past performance is not an indication of future results.
Source: eToro
Why is customising MACD for different markets important?
Customising the MACD indicator is important because, when adjusted, the parameters of the metrics used to interrogate price data can better suit individual trading strategies. For example, traders following short-term strategies would give more weight to signals developed using the MACD lines and histograms using shorter-term moving averages as a data source.
Tip: There are many variants of the basic MACD indicator, each one offering a different insight into market conditions.

Final thoughts
Some of the formulae used to create the MACD may appear to be complicated, but can become manageable after understanding that the indicator is based on straightforward metrics: moving averages. The MACD manipulates the MA numbers to provide a useful insight into market mood, thus, pinpointing buy and sell signals.
Learn more about the MACD indicator with the eToro Academy.
Quiz
FAQs
- How can traders differentiate between false and genuine MACD signals in complex market scenarios?
-
The best way to establish greater confidence in a MACD signal is to wait for price action to support your MACD analysis. This could involve waiting for price to break a significant trendline, which would suggest that there is sufficient momentum for a new trend to form.
- What are the best practices for setting MACD parameters in volatile versus stable markets?
-
During times when markets are stressed and price volatility rises, the MACD can generate a greater number of signals than is practical to trade. Some of those will also be false signals due to the volatility of the market. Adjusting the parameters of the moving averages to higher time frames can smooth out the readings and help to make the indicator more effective.
- How can the MACD be utilised to gauge the strength of a trend and potential exhaustion points?
-
If the two moving averages on your MACD monitor are diverging, then momentum is increasing. If they are converging, then momentum is weakening.
This information is for educational purposes only and should not be taken as investment advice, personal recommendation, or an offer of, or solicitation to, buy or sell any financial instruments.
This material has been prepared without regard to any particular investment objectives or financial situation and has not been prepared in accordance with the legal and regulatory requirements to promote independent research.
Not all of the financial instruments and services referred to are offered by eToro and any references to past performance of a financial instrument, index, or a packaged investment product are not, and should not be taken as, a reliable indicator of future results. The availability of all the above-mentioned products and services may vary by jurisdiction and country.
eToro makes no representation and assumes no liability as to the accuracy or completeness of the content of this guide. Make sure you understand the risks involved in trading before committing any capital. Never risk more than you are prepared to lose.