


Develop your understanding of technical analysis oscillators. Use practical examples that explain how to use them as part of advanced strategy planning.
An oscillator is a technical analysis tool that creates high and low bands to mark two extreme values. Oscillators then build a trend indicator that fluctuates between these levels to highlight instances in which a market might be overbought or oversold.
Oscillators perform the crucial function of measuring market momentum. The term refers to a range of indicators, including stochastic oscillators, moving average convergence/divergence (MACD) and the Relative Strength Index (RSI). Oscillators can be used in conjunction with other indicators and measure the strength and velocity of price changes. This makes them an ideal tool for those looking to introduce more advanced aspects of technical analysis into their trading.

Why are oscillators integral parts of trading strategy?
Oscillators are integral parts of trading strategy because they expand on the core principles of many useful and popular
On any trading dashboard, the metrics appear in a separate monitor that ranges from 0 to 100, with readings above 50 suggesting that the market is overbought, and under 50 that it is oversold. The greater the distance from 50, the stronger the signal, with market convention being that signals become significant when an oscillator prints at levels above 70 and below 30.
Traders should consider the particular source data from which the standard levels of 30 and 70 are generated. The default oscillator settings are a good starting point for investors and can illustrate the trade entry and exit points on which many other traders are focusing. However, adjusting the levels to market conditions and individual trading styles can potentially result in a more accurate analysis of price movement.
If you set your strategy to work off the levels of 75 and 25, you might be less likely to enter into a trade, but you can expect a higher win-loss ratio when you do. Also, consider whether market conditions favour using one oscillator over another. They all use different data sources — MACD, for example, considers the relationship between two moving averages, and stochastic oscillators use the previous session’s closing price as a cornerstone of their formulae.
Tip: The popularity of oscillators means that many traders will book trades at the standard levels.
When are oscillator strategies most effective?
Oscillator strategies are most effective and more reliable in markets that trade sideways within a specified price range. The lack of an upward or downward trend reduces the risk of the indicator generating a reading above 70 or below 30 for a sustained period of time. This then leads to positions being stopped out at a loss.
In a “quiet” market, it is common to trade
After adding an oscillator to a price chart, advanced analysis aims to filter out the good signals from the false signals.

Combining oscillators with other indicators
Strategies are more effective if they combine signals from oscillators with analysis drawn from other indicators. It’s possible to use a blend of different oscillators. The Money Flow Index (MFI), RSI and MACD all use different source data, and, therefore, measure different market phenomena.
Oscillators can be used with different types of indicators, such as the static signals generated by trendlines, pivot points, and support and resistance levels. Those points on a price chart pinpoint times when oscillator readings might predict the reversal of a short-term trend.
In the example below, bitcoin posts a new all-time high in the region of the psychologically important $70,000 price level. The cryptoasset tests both of those resistance indicators at the same time as the MACD histogram monitor moves from positive to negative territory, a bearish indicator.
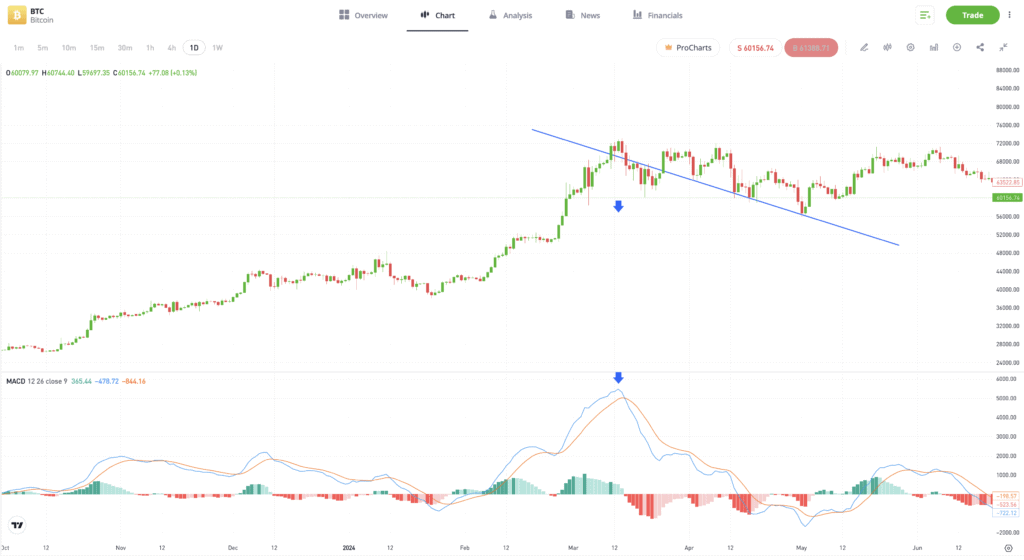
Past performance is not an indication of future results.
Source: eToro
Applying oscillators to real-world trading scenarios
Traders can apply oscillators in real-world trading scenarios by combining different indicators in one trading strategy. In the example below taken from the GBPUSD forex market, the stochastic oscillator moves to above 80, suggesting that the market is oversold on the daily time frame. Soon after that signal is generated, there is a downward price movement.
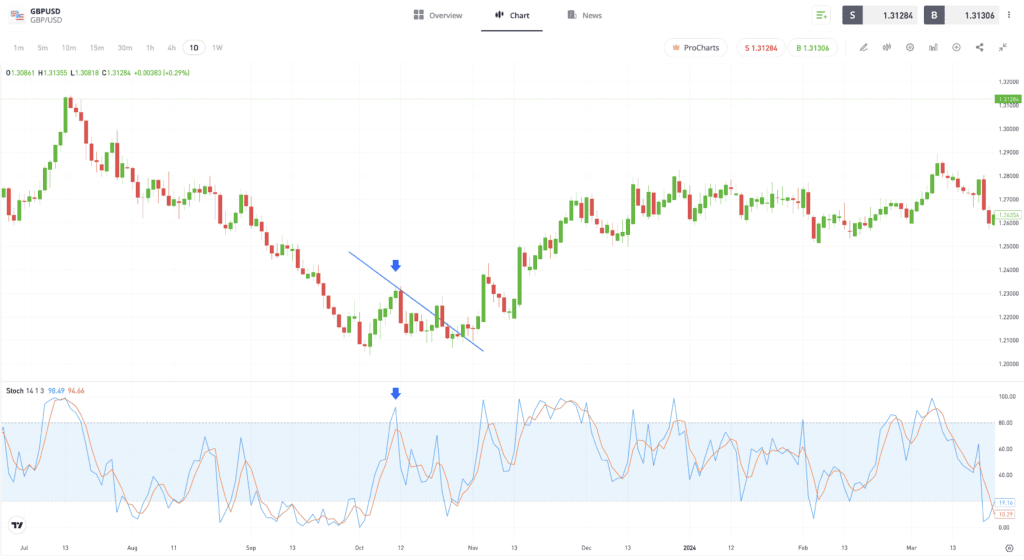
Past performance is not an indication of future results.
Source: eToro
More advanced oscillator analysis can include charting techniques that help strategies to move away from the basic overbought or oversold metrics. The trendline break below of a downward pattern in the RSI occurs when that indicator is giving a reading of 42.3, which is some distance from the standard levels used to spot an oversold market. However, this does coincide with the start of an upward price move in the GBPUSD market.
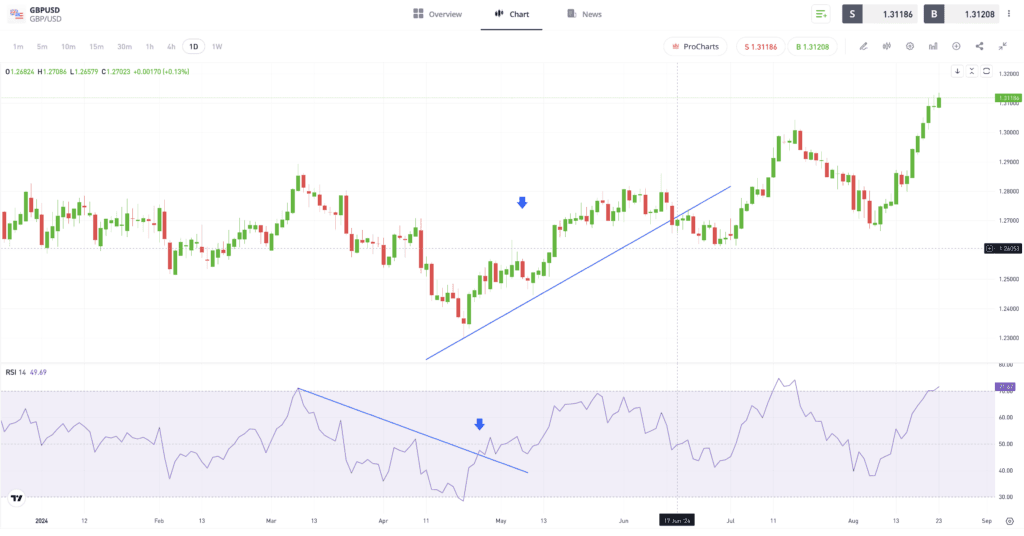
Past performance is not an indication of future results.
Source: eToro
Tip: Oscillators help to spot trading signals that aren’t related to the classic oversold and overbought levels of 30 and 70.
Tailoring oscillators to fit market conditions
When new trends form, and price breaks out of an established trading range, oscillators that are not tailored to this market change can become less effective at identifying trading opportunities. False signals may often be generated during trends as an oscillator can show a reading of above 70 or below 30 for a considerable time.
One approach to this drawback of oscillators is to consider trading another market, one that is trending sideways and is better suited to using oscillators. Other options include adjusting the time parameters of the oscillator to look for a longer-term trading opportunity or using a more risk-averse entry point that is closer to 0 or 100 than 30 or 70.
Tip: The greater the number of indicators which give a combined reading — the stronger the overall signal.
It can also be worthwhile to consider which type of asset to trade. Historical data points to stock markets having a natural bias to climb upwards. Currency markets also experience similar long-term trends, but there is less evidence of those being upward or downward, making forex markets a good place to start testing an oscillator strategy.

Final thoughts
Oscillators are powerful and useful tools that measure a key component of market conditions: momentum. However, getting the most out of them involves appreciating their limitations as well as their value. Advanced technical analysis strategies that factor in other indicators provide a more balanced and effective way of getting fewer, but more effective signals.
Discover more trading analysis techniques with eToro Academy.
Quiz
FAQs
- How can advanced oscillator analysis help to identify market momentum shifts?
-
A divergence between price action and oscillatory reading can signal that a trend is about to end or reverse. A bearish divergence occurs when a higher high on a price chart is not matched by a higher high in the oscillator monitor.
- What are some common mistakes that traders make when using oscillators, and how can they be avoided?
-
Oscillators give a reading on market momentum, but without the use of other indicators, they cannot accurately establish market direction. It is also worth avoiding the pitfall of only using oscillators to identify times when markets are over or undersold. Due to their versatility, they should not only be used in that way.
- In what ways can oscillators be adjusted to enhance their effectiveness across various trading environments?
-
The more volatile a market, the greater the risk that it can overshoot in either direction. If that is the case, then overbought and oversold parameters could be set higher and lower than the standard 30/70 levels.
This information is for educational purposes only and should not be taken as investment advice, personal recommendation, or an offer of, or solicitation to, buy or sell any financial instruments.
This material has been prepared without regard to any particular investment objectives or financial situation and has not been prepared in accordance with the legal and regulatory requirements to promote independent research.
Not all of the financial instruments and services referred to are offered by eToro and any references to past performance of a financial instrument, index, or a packaged investment product are not, and should not be taken as, a reliable indicator of future results. The availability of all the above-mentioned products and services may vary by jurisdiction and country.
eToro makes no representation and assumes no liability as to the accuracy or completeness of the content of this guide. Make sure you understand the risks involved in trading before committing any capital. Never risk more than you are prepared to lose.