


Develop your understanding of pivot point indicators using practical examples. Learn how to incorporate these marks into your advanced technical analysis.
Key price levels from a previous day’s trading session may influence price moves the following day, and pivot points can help traders to calculate areas on a chart where price might meet support and resistance in the future, by deciphering the previous day’s levels. These principles can be used as part of advanced technical analysis strategies.

What are pivot points in market analysis?
Pivot points are indicators that offer traders an insight into the next day’s price levels.
The indicator uses the previous day’s closing price,
The formulas used to calculate them are fairly straightforward, with the primary pivot point being the sum of the high, low and closing price, divided by three.
- Pivot Point = (High + Low + Close) ÷ 3
Additional support and resistance levels are calculated by using formulas that process those same numbers from the previous day and the primary pivot point in slightly different ways.
- Resistance 1 = (Pivot point × 2) − Low
- Resistance 2 = Pivot point + (High − Low)
- Support 1 = (Pivot point × 2) − High
- Support 2 = Pivot point − (High − Low)
Tip: Pivot points can be adapted to different time frames by using high, low and closing price on an hourly chart.
How can pivot points help to advance technical analysis?
Traders can consider using a variety of pivot point markers to help advance their trading strategy. Basic pivot point analysis generates five or seven clear lines that mark potential areas of support and resistance. Here are two different techniques that work to optimise a trading strategy.
Market opening with classical pivot points
Advanced traders should pay close attention to the market opening because this period in the trading session is typically associated with higher
Laying out your pivot points before the opening bell may allow you to make an early call on whether it is likely to be an up day or a down day, depending on where price opens in relation to pivot points. A market that opens below the pivot point is a
Camarilla pivot points with Fibonnaci numbers
Camarilla pivot points use the same source data as classical pivot points while incorporating Fibonacci numbers into the calculation. Camarilla pivot points work in the same way as Fibonnaci numbers, but generate nine rather than five support/resistance levels. Camarilla pivot points can potentially be more effective in markets that are showing a tendency to revert to the average trend while trading within a range.
Tip: Pivot points are widely used and so, with so many traders watching them, they can become a self-fulfilling prophecy.
Combining pivot points with other technical indicators
Pivot points work best when combined with other indicators, and the basic support and resistance levels that pivot points indicate can be extremely useful. However, it is essential to use pivot points alongside momentum indicators because these techniques can help to establish whether a support/resistance level is going to hold or be broken through.
The Relative Strength Index (RSI) measures the extent to which a market is over or undersold and, as a result, is commonly used in conjunction with pivot points. If the RSI reading is neutral by the time that price reaches the pivot point, there is less reason to believe that the pivot point will act as support or resistance than if the RSI was indicating that the market was under or oversold.
Trading volume is another metric worth watching. If volume picks up when price reaches a pivot point, it suggests that a large number of traders are watching the situation develop. The greater the volume, the stronger the ultimate reading on whether a short-term trend reverted or carried on through the support/resistance level. If a pivot point aligns with another important indicator, such as a moving average, that makes the support/resistance level stronger.

How to use pivot points in real-world scenarios?
Taking data from a previous trading session and using it to predict support and resistance levels in the subsequent one makes pivot points very popular with the majority of day traders. They are commonly used in markets that are targeted by more speculative traders, including currencies, indices, stocks and futures.
In the chart below of Tesla Inc. stock, pivot points can help to track how price bounces upwards and downwards across multiple days. The relatively simple indicator shows its effectiveness over the chosen time period by depicting how price opened below the primary pivot point on five consecutive days, and posted a down day on four of the days.
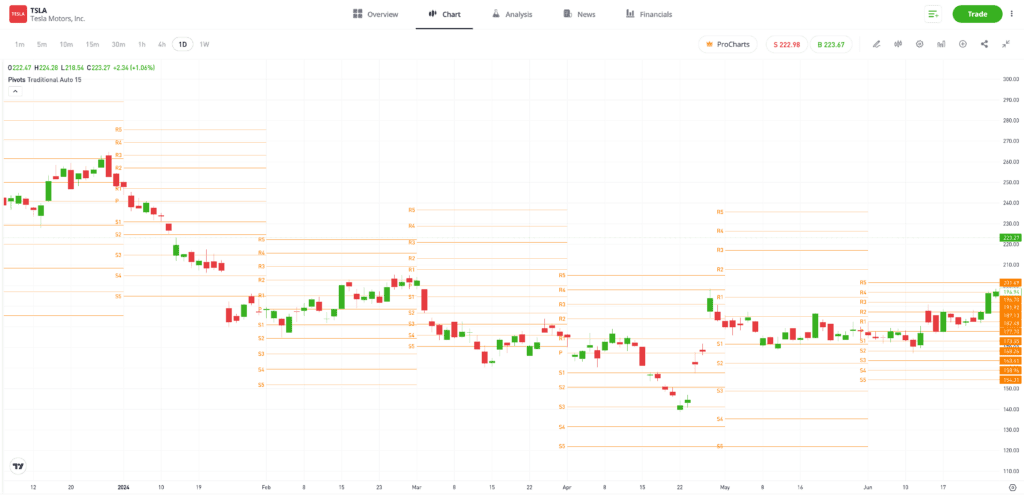
Past performance is not an indication of future results.
Source: eToro
A helpful customisable feature of pivot point indicators is that they offer suggestions on the price chart as to where stop-loss instructions can be set. For example, traders who are predicting a bounce off of support level 1 can consider setting a stop loss just below support level 2.
Tip: Unlike other technical indicators, pivot points are static and remain in the same place throughout the trading session.
How to tailor pivot point strategies to individual trading styles?
Pivot points are a customisable indicator that can be set to any time frame and work alongside other technical indicators to create a potentially robust and well-rounded trading strategy. Traders running extremely short-term strategies could set pivot points to be generated as frequently as every minute.
Investors with a longer-term strategy may find pivot points to be less effective. The levels could potentially give off false signals if market liquidity dries up or news events are dominating trading decisions, and over the long-term, there is more opportunity for such situations to arise. Higher time frames are typically used more often in the wider market for this reason.

Final thoughts
Pivot points are static and are considered lagging indicators. They offer a convenient framework to help traders with shorter-term trading strategies to more easily navigate a trading session. While they are a useful tool and will mark times when price bounces off resistance or support, they are best used in conjunction with other indicators and used as part of an overall plan.
Discover more about pivot points on the eToro Academy.
Quiz
FAQs
- How can traders identify and interpret different pivot point levels for optimal trading decisions?
-
The most important pivot point is the primary one, as this is used as a base from which to calculate the additional support and resistance levels. If price breaks through the primary pivot point, many traders may decide that a market is going to have an up day or a down day, depending on the direction of the price trend.
- What are the common pitfalls to avoid when using pivot points in trading analysis?
-
Pivot points are lagging indicators because they are created by historical data. This reduces their effectiveness at predicting future price moves. Market dynamics can also play a significant part in decreasing the effectiveness of pivot points. For example, if a major news announcement is made, price could potentially whipsaw.
- How can pivot points be effectively used in conjunction with other technical analysis tools to forecast market movements?
-
Pivot points work well with dynamic indicators, especially those that measure momentum such as MACD and moving averages.
This information is for educational purposes only and should not be taken as investment advice, personal recommendation, or an offer of, or solicitation to, buy or sell any financial instruments.
This material has been prepared without regard to any particular investment objectives or financial situation and has not been prepared in accordance with the legal and regulatory requirements to promote independent research.
Not all of the financial instruments and services referred to are offered by eToro and any references to past performance of a financial instrument, index, or a packaged investment product are not, and should not be taken as, a reliable indicator of future results. The availability of all the above-mentioned products and services may vary by jurisdiction and country.
eToro makes no representation and assumes no liability as to the accuracy or completeness of the content of this guide. Make sure you understand the risks involved in trading before committing any capital. Never risk more than you are prepared to lose.