


Develop your understanding of stochastic oscillators with real-world trading scenarios. Learn how to use them and create an advanced trading strategy.
- What is a Stochastic indicator?
- How to create a strategy with a stochastic indicator
- Combining the stochastic indicator with other technical tools
- Case studies: stochastic indicators in successful and unsuccessful trades
- Why is integrating the stochastic indicator into a trading strategy important?
- Final thoughts
- Quiz
- FAQs
Stochastic oscillators are widely used indicators that can be applied to any market and over any time frame. They are typically used to measure changes to price momentum and can be incorporated into a wide variety of strategies.

What is a Stochastic indicator?
A stochastic indicator is an oscillating indicator that detects when price moves are about to occur. Relative Strength Index (RSI) and moving average convergence/divergence (MACD) are two of the most popular examples of stochastic indicators. Oscillators monitor price data to identify particular moments when the pace of price movement changes.
In this way, stochastic analysis provides a reading on whether momentum is increasing or decreasing. Using this indicator, traders can determine whether a price trend is likely to continue or revert. Understanding how the indicator works to provide relatively straightforward
Comparing the closing price of a trading session or time interval to a longer-term average is the cornerstone of stochastic analysis. This comparison often provides an indication as to whether a market is beginning to move in one direction or another. Like all technical indicators, higher time frames in stochastic analysis can often show more accurate signals than shorter, fluctuating time frames.
More advanced analysis starts by formatting variables to suit individual trading strategies. For example, investors interested in short-term speculative trading strategies could adjust their time intervals to shorter ones. While the basic overbought and oversold readings are useful, adjusting the model’s parameters will offer different ways of identifying trade entry and exit points.
Tip: Like other oscillators, stochastic indicators offer readings on the strength of a trend, but not its direction.
How to create a strategy with a stochastic indicator
A popular way of introducing stochastic analysis into a trading strategy is to build additional readings and chart lines into the indicator’s monitor.
For example, a moving average crossover technique involves traders monitoring times at which a basic stochastic reading (as seen by the blue line in the GBPUSD forex chart below) intersects with a moving average from a different time frame (as seen by the red line).
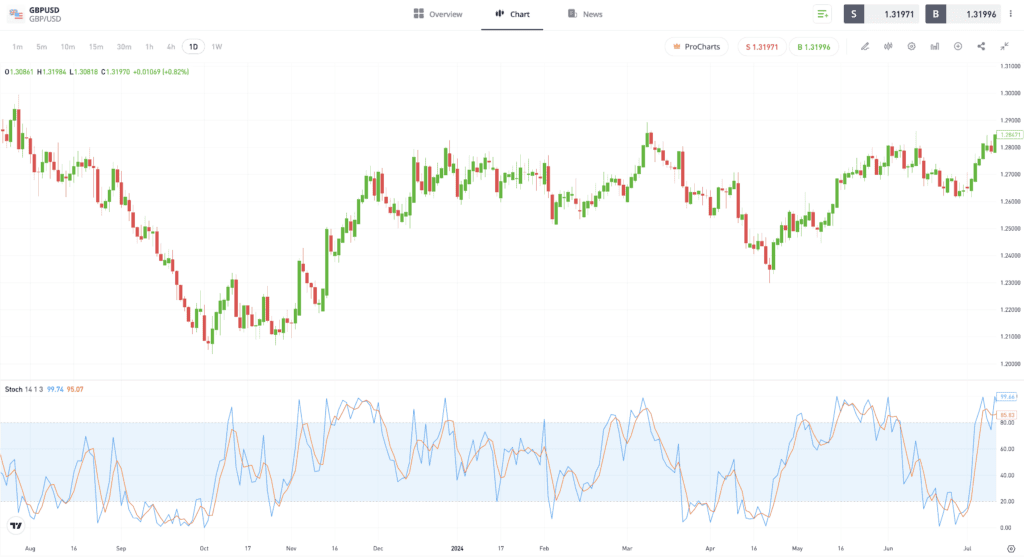
Past performance is not an indication of future results.
Source: eToro
In the same price chart pictured below, the parameters have been adjusted. In this example, there are instances of false signals being generated at times during which the market is oversold. However, being patient and waiting for the indicator to move above 20 and the oversold level would allow traders to take advantage of the formation of a more substantial upward trend.
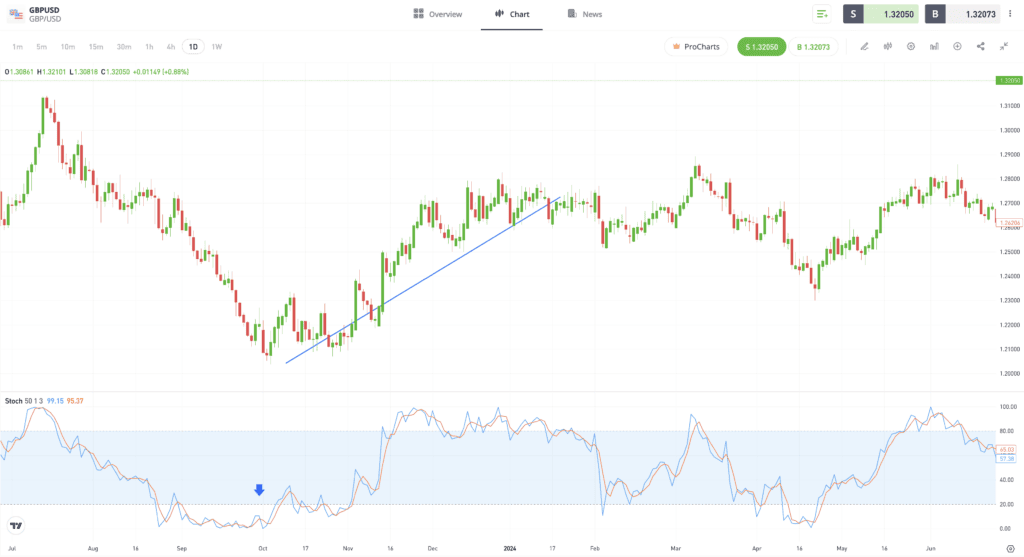
Past performance is not an indication of future results.
Source: eToro
Tip: Don’t use stochastics solely in oversold and overbought markets. Use them to enter into trends that have already formed.
More advanced analysis also involves using charting techniques to interrogate the data generated by the stochastic monitor. The S&P 500 Index price chart found below offers a buy signal when the stochastic reading moves below 20. Again, price continues to move in the same direction, potentially running the risk of a buy trade being stopped out. However, the later signal, which uses more advanced charting principles, identifies an intersection of the downward trendline in the monitor itself, and a better entry point for those looking to buy the dip.
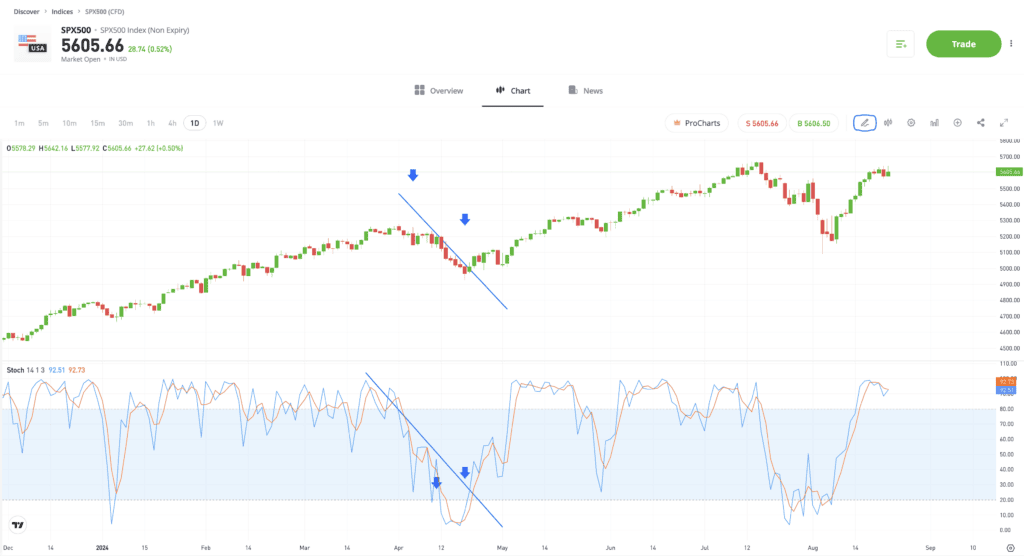
Past performance is not an indication of future results.
Source: eToro
Combining the stochastic indicator with other technical tools
One of the most important features of advanced stochastic indicator analysis is recognising the importance and benefits of incorporating other indicators into your decision-making. Oscillators are great at measuring momentum, but other indicators help to pinpoint additional reasons why those changes in market mood might be significant.
Static indicators such as pivot points, trendlines, and support and resistance levels fit well with the stochastic indicator. These indicators work to decipher the reasons that buy/sell pressure could increase. If momentum is waning, a price reversion and continuation of the existing underlying trend is more likely. Stronger momentum signals there is a greater chance of a breakout occurring.

Case studies: stochastic indicators in successful and unsuccessful trades
The price chart below, taken from the copper market, offers an example of how using other indicators in conjunction with stochastics can encourage successful trades and trade management.
The signal to sell short, which is triggered by the stochastic indicator rising above 80, is followed by further upward price moves. Markets can remain overbought or oversold for some period of time, and in this instance, entering into a short position at the first opportunity would have increased the risk of that trade being stopped out.
Showing patience and waiting for the stochastic indicator to return below 80 would allow time for the downward trend to form. An additional bearish signal that supports the idea of selling short is provided by price crossing through the 9-day moving average around the same time.
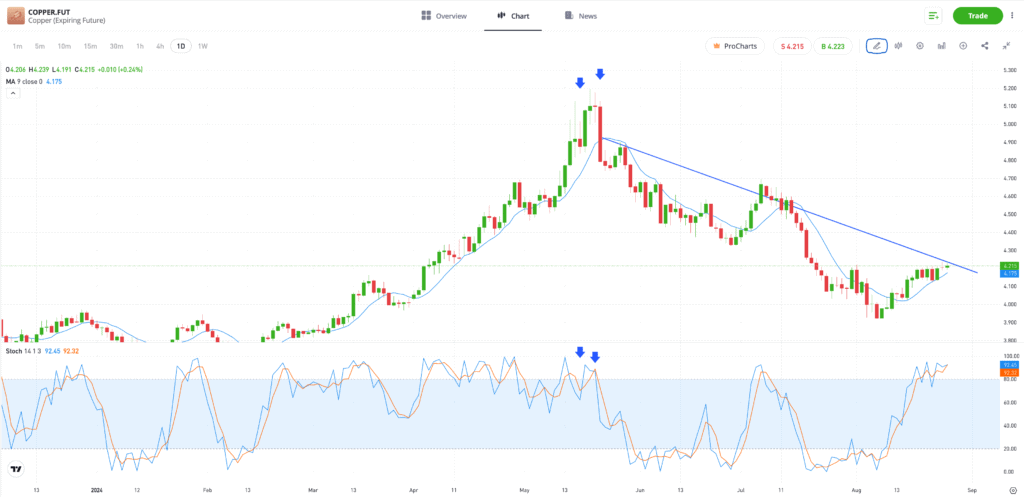
Past performance is not an indication of future results.
Source: eToro
No trading indicator is 100% effective, and the price chart below, taken from the Nasdaq 100 Index market offers an example of a stochastic indicator failing, and giving off an incorrect signal. The moment the stochastic moves below 20, is, according to the principles of technical analysis, a potential buy signal. Unfortunately, for anyone entering into a long position, the price of the index continues to fall.
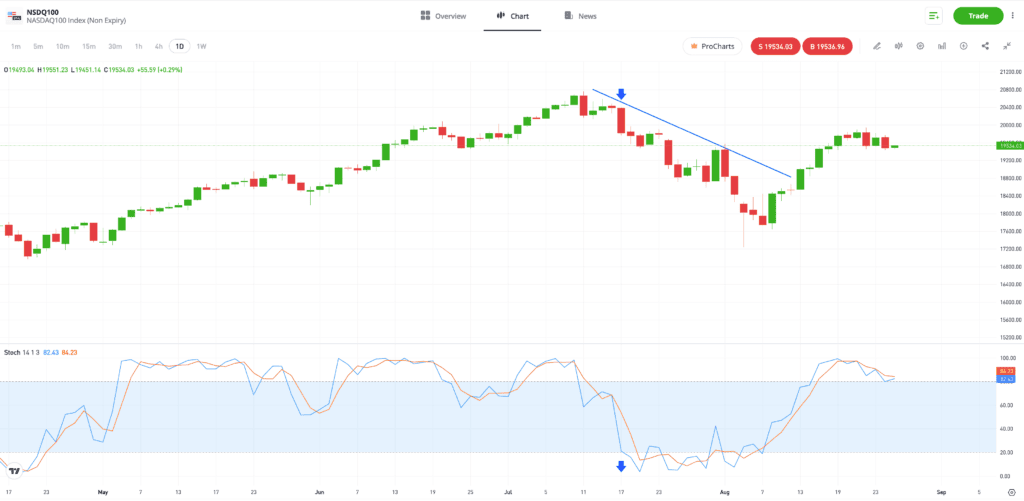
Past performance is not an indication of future results.
Source: eToro
Why is integrating the stochastic indicator into a trading strategy important?
Incorporating advanced aspects of stochastic analysis into a trading strategy can help traders to filter out false signals that not only increases the potential win-loss ratio, but also reduces the risk of overtrading.
One common pitfall to avoid is over-optimisation. This happens when the metrics on the stochastic indicator are adjusted to a point where
Tip: Stochastic indicator readings can be adjusted so that they are smoothed out, which reduces “noise” when price volatility increases.

Final thoughts
The stochastic oscillator indicator is a popular tool that is likely to generate a variety of trade entry and exit signals. Using it in a more professional manner involves incorporating other signals from other indicators, not just overbought and oversold signals. Adopting a more rounded approach will provide the best route towards an advanced trading strategy.
Discover more technical indicators with the eToro Academy.
Quiz
FAQs
- How can traders differentiate between valid and false signals generated by the stochastic indicator?
-
No matter how experienced, a trader cannot definitively decipher a valid or false signal until enough time has passed for the trade set-up to be fully tested. One way to aid this process is to use other indicators and establish whether or not they support the signal given by the stochastic indicator. The greater the number of aligned indicators, the stronger the signal.
- What are the best practices for setting stochastic indicator parameters to suit various trading environments?
-
If a strategy has a short-term focus, such as day trading, for example, then using stochastics that operate using shorter-term metrics will be a better fit. It’s worth noting that news announcements and geopolitical events can also affect price volatility. When volatility levels change, stochastic parameters will most likely need adjusting.
- How can the stochastic indicator be used to enhance risk management in trading strategies?
-
Stochastic indicators offer clues as to whether a current trend will continue, or end and reverse. If you are fortunate enough to be in a winning trade, then, signals that the trend is about to weaken can be managed by scaling out of a position or adjusting stop losses to protect gains.
This information is for educational purposes only and should not be taken as investment advice, personal recommendation, or an offer of, or solicitation to, buy or sell any financial instruments.
This material has been prepared without regard to any particular investment objectives or financial situation and has not been prepared in accordance with the legal and regulatory requirements to promote independent research.
Not all of the financial instruments and services referred to are offered by eToro and any references to past performance of a financial instrument, index, or a packaged investment product are not, and should not be taken as, a reliable indicator of future results. The availability of all the above-mentioned products and services may vary by jurisdiction and country.
eToro makes no representation and assumes no liability as to the accuracy or completeness of the content of this guide. Make sure you understand the risks involved in trading before committing any capital. Never risk more than you are prepared to lose.