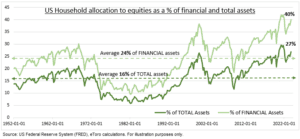
RETAIL: Retail investor numbers are growing fast. Up by a quarter in two years, led by younger and female investors. They own near a third all US stocks, for example. And households have over a quarter all their assets in shares, near a record. Yet they are poorly understood. Our survey of 10,000 self-directed investors in 13 markets, from US to Australia and Europe, seeks to change this. DIY investors are loyal to the big tech, AI, and crypto assets that have served them well recently. But many are planning to rebalance to cheaper and overseas assets ahead of rate cuts. And ignoring the adage to ‘not mix politics with portfolios’ in this huge election year.
RATE CUTS: Retail investors are readying for looming rate cuts, our 2nd bull market pillar. 53% plan to rebalance their portfolios. Looking to boost equity investments (48%), especially dividend stocks (33%), and holding less cash (36%). The banking and real estate sectors are second and third in investor preferences, after tech. Similarly, Europe and emerging markets are ranked second and third after the US. This makes sense. These cheaper and smaller assets are more sensitive to the economic soft landing and lower interest rates outlook than super-sized US or big tech. We see this performance rotation as the biggest stock market driver from here.
POLITICS: A record election year is seeing investors mix politics with their portfolios. With 49% considering their investments when deciding who to vote for. Led by those in the US, Germany, Poland and the youngest 18-34 investor cohort. Whilst Danes, Dutch, and those 55+ see politics as less important for portfolios. Retail investors’ political views typically skew to the right. But with a significant 14% middle ground of undecideds that could determine tight election races. Geopolitics have surged to be the third biggest perceived investment concern, by 17% of those polled. Behind the falling inflation concerns and rising global recession risks that jointly lead.

All data, figures & charts are valid as of 25/03/2024.


