


Analyst Weekly, March 9, 2026
Last week we wrote about how markets were waking up to geopolitical risk and outlined the key scenarios investors should watch. One week later, markets are beginning to price those risks more decisively, and the clearest signal is coming from energy. Geopolitical shocks often prompt investors to reduce risk quickly, particularly when markets have built up crowded positions. This can lead to sharp but temporary market moves as positions are unwound.
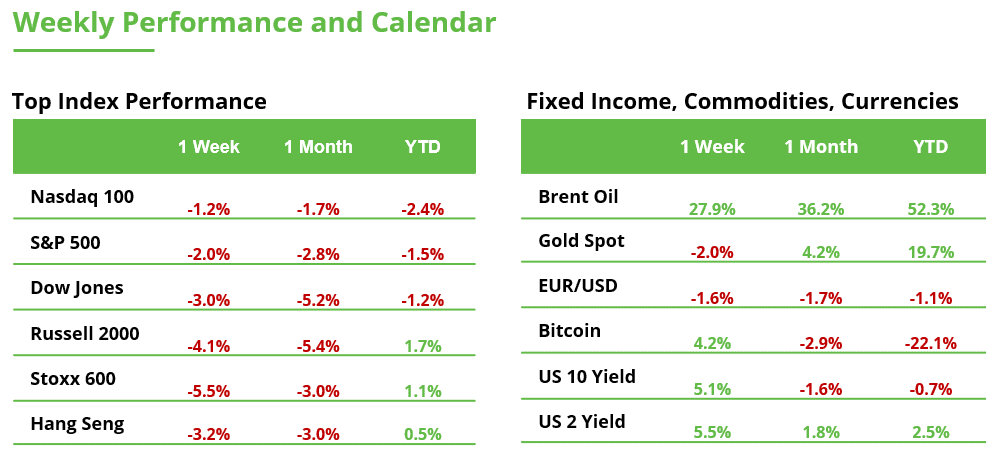
Oil Is Leading the Market Reaction
Oil has surged as investors reassess the risk to supply flows through the Strait of Hormuz. Brent crude has jumped to its highest in more than two years, reflecting a growing geopolitical risk premium. At the same time, US gasoline prices have climbed to around $3.91 per gallon, the highest level in about two years.
The issue is becoming increasingly logistical rather than purely geopolitical. Energy analysts estimate that there are roughly 2–2.5 million barrels per day of production disruptions, with the potential for more than 4 million barrels per day if storage limits are reached. Tanker availability has also collapsed, with roughly 14 very large crude carriers currently operating in the Gulf compared with about 64 before the escalation, sharply limiting export capacity.
For investors, this reinforces one key point: markets are starting to trade energy supply risk.
Investment Takeaway: Energy markets currently show an asymmetric risk profile. Oil prices may fall modestly if tensions ease, but supply disruptions could push prices significantly higher, making energy exposure a useful hedge in diversified portfolios.
Volatility Is Rising, But Panic Has Not Arrived
Despite the rise in volatility, markets are not yet showing signs of full panic. Investors are buying protection rather than exiting equities entirely.
One notable trend is that options demand for downside protection has increased, meaning investors are paying more for insurance against a potential pullback. This is typical during geopolitical shocks, volatility spikes even when equity markets have not yet fallen significantly.
Investment Takeaway: For investors, the environment favors balanced positioning: maintaining exposure to equities while considering hedges and sectors (energy, defense, high quality dividend-paying companies) that benefit from geopolitical uncertainty. Energy ETFs such as XLE or USO tend to move more sharply when oil volatility ($OVX) rises.
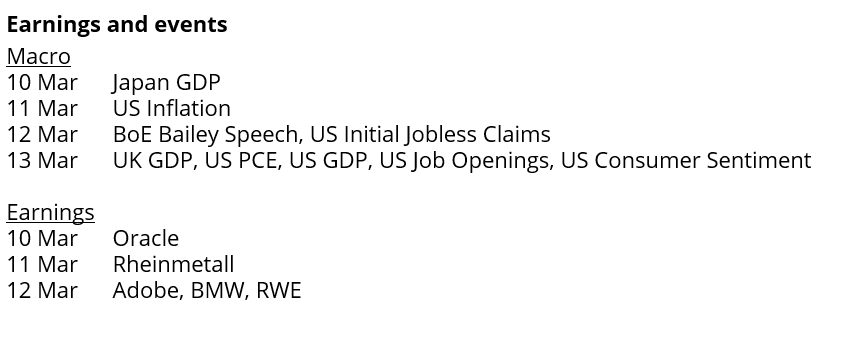
Defense Spending Tailwinds Are Emerging
Another clear market signal is the move in defense stocks.
US officials recently met with major contractors including Lockheed Martin, Northrop Grumman, RTX, Boeing, Honeywell, and L3Harris to discuss accelerating defense systems production. Reports suggest Congress could request roughly $50 billion in emergency defense funding to support military operations.
Historically, sustained geopolitical tensions have improved revenue visibility for defense contractors.
Rheinmetall Under Pressure: Will the Support Zone Hold?
Rheinmetall shares fell 4.2% last week, closing at €1,594. The stock is now about 21% below its record high of around €2,004, reached in September. Since May, the stock has repeatedly come under stronger selling pressure. From a technical perspective, the Fair Value Gap between €1,463 and €1,543 has recently played a key role. This zone has acted several times as a support area and helped stabilize the price.
The quarterly results and updated outlook on Wednesday are likely to be decisive. If the stock manages to move away from this zone, it could make another attempt toward its record high. However, if it breaks below, the deeper support zone between €1,010 and €1,070 would come into focus.
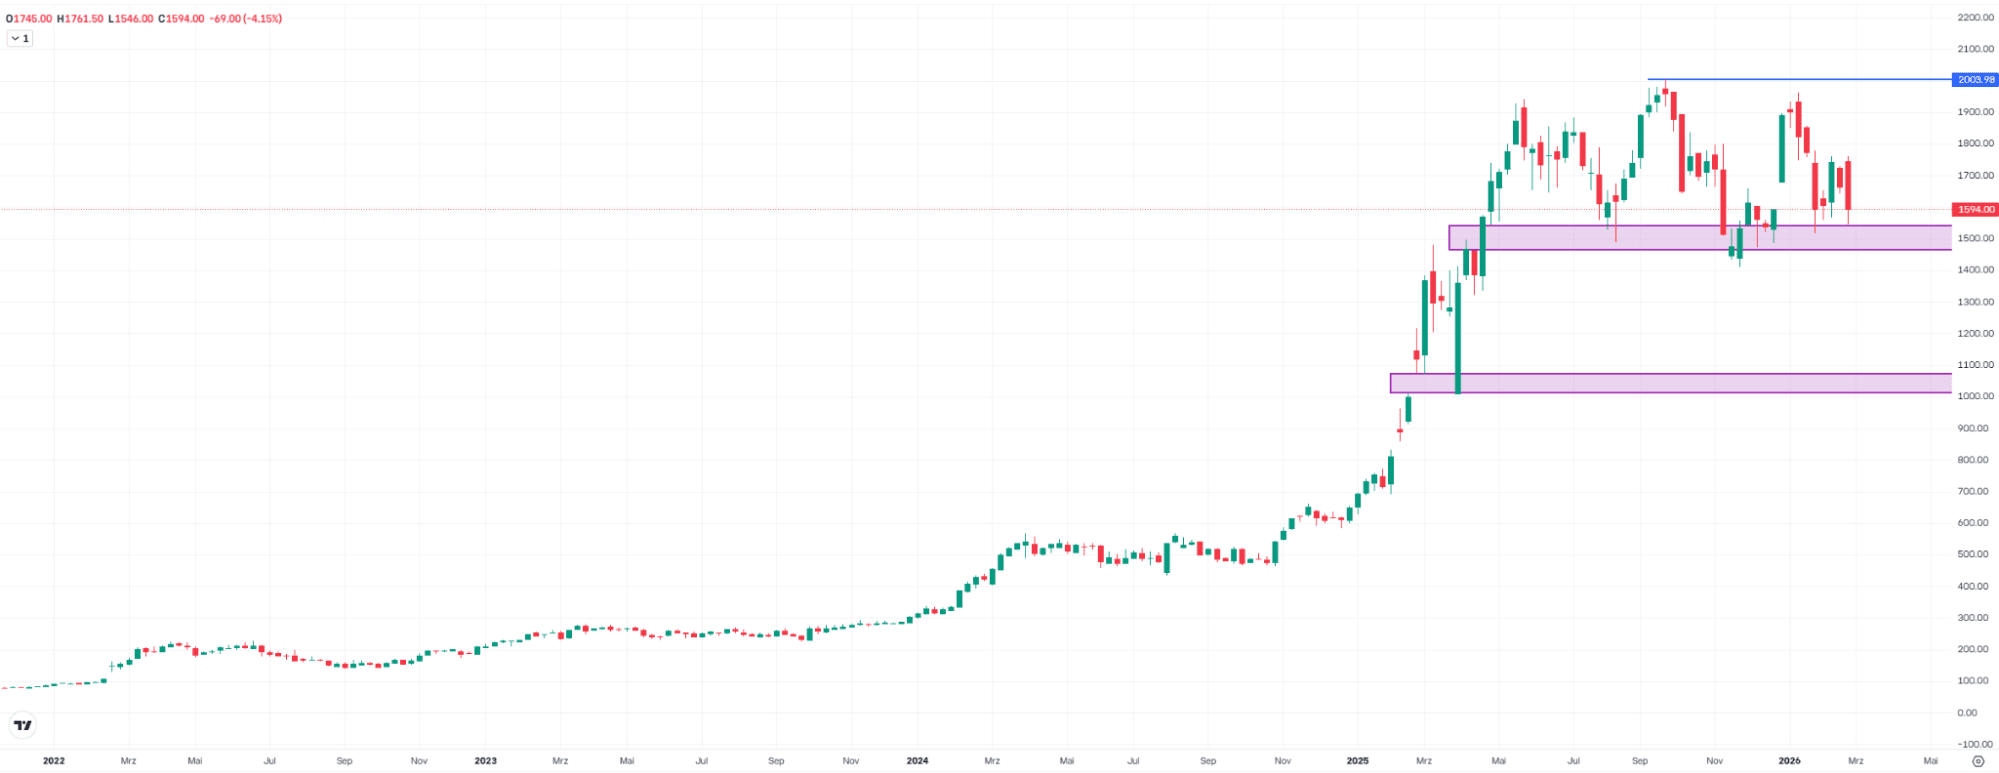
Rheinmetall, weekly chart. Source: eToro
Dollar Near a Critical Resistance Zone
The US Dollar Index rose 1.3% last week to 98.60, marking its strongest weekly gain since November 2024. About six weeks ago, the index turned higher after the 95.91 level was successfully defended for the second time. This could form a classic triple bottom. Since the January low, the index has gained 3.6%.
If the dollar continues its short-term rebound, a well-known Fair Value Gap quickly comes into focus. The zone between 99.90 and 100.88 has been defended several times by sellers since April. A breakout above this level could be tantamount to a relief rally. However, if buyers fail again at or around this resistance, another wave of selling may follow.
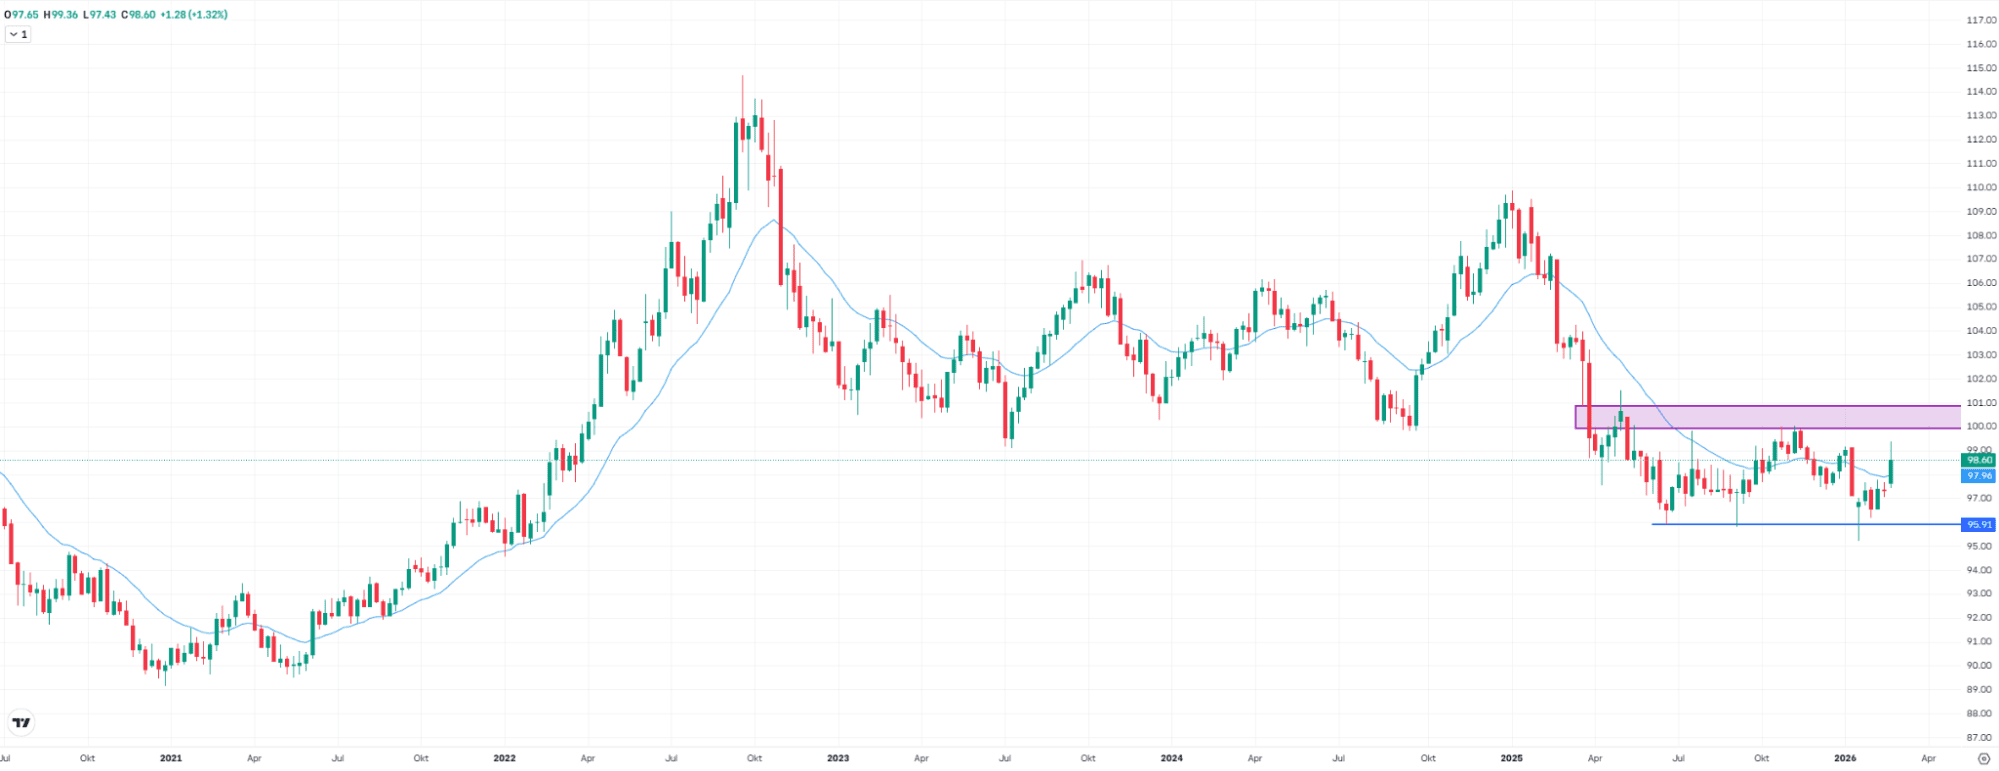
USDOLLAR, weekly chart. Source: eToro
Oil Prices High, But Long-Term Inflation Expectations Remain Stable
Long-term inflation expectations stood at 2.14% on Friday. A key indicator in this context is the so-called 5-Year, 5-Year Forward Inflation Expectation Rate (5y5y). It reflects the average inflation rate the market expects for a five-year period starting five years from now.
The 5y5y does not measure current inflation but rather long-term confidence in price stability. As long as it remains stable, temporary shocks, such as rising oil prices, are considered transitory. In that case, inflation expectations are seen as well anchored.
If the 5y5y were to rise sharply, it would signal that the market expects persistently higher inflation. Confidence in price stability would decline, and central banks would come under pressure.
At 2.14%, long-term inflation expectations are currently broadly stable. Markets appear to believe that central banks can maintain price stability over the medium term. There is no clear sign of unanchored inflation at this stage.
A temporary oil price shock typically has little impact on the 5y5y. Only if structural inflation risks emerge would this indicator likely move significantly higher.
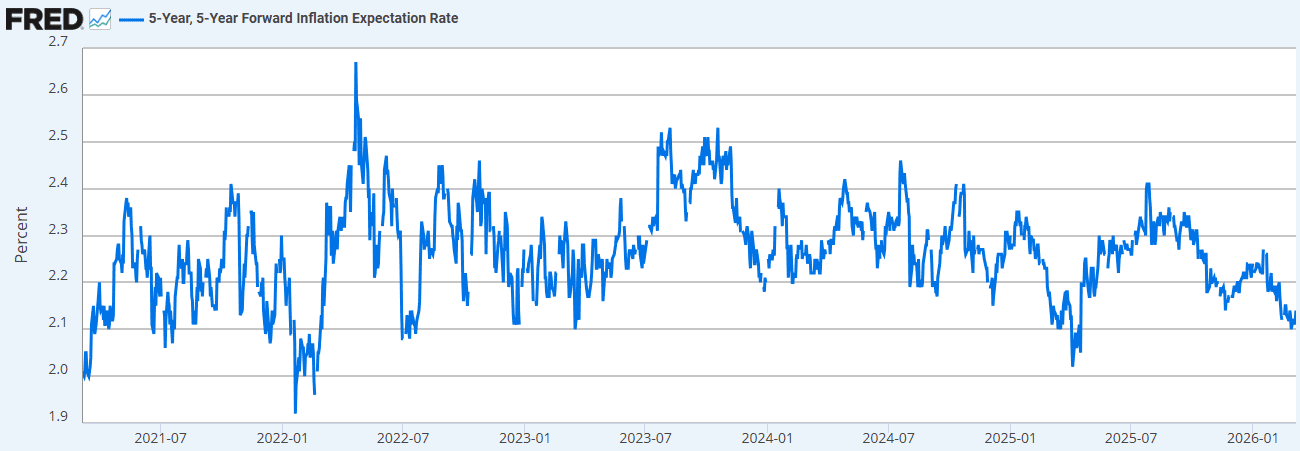
5y5y. Source: Federal Reserve Bank of St. Louis via FRED
Bitcoin stabilizes as institutional flows begin to rebuild
The crypto market appears to be transitioning rather than decisively turning. After several months of weakening demand and deteriorating capital flows, early signs of stabilization are starting to emerge. However, it is still too early to conclude that a new structural uptrend has begun.
Short-term capitulation likely passed recently, while bitcoin ETF flows have stopped deteriorating and have turned marginally positive. Roughly $700 million in net inflows were recorded over a 48-hour period, marking the first constructive development in months. That said, a few days of inflows do not define a new regime. Sustained ETF accumulation over several weeks would confirm that structural demand is rebuilding.
From an on-chain perspective, demand activity has clearly cooled. Daily Realized Profit (which measures the gains investors lock in when coins move on-chain) has fallen by approximately 63%. This drop reflects a meaningful slowdown in capital rotation and speculative activity, a pattern that historically tends to emerge when bitcoin enters post-rally consolidation phases.
At the same time, “Supply in profit” has fallen to roughly 57%, approaching levels typically associated with early consolidation phases in previous cycles. This does not necessarily signal a structural bear market, but it does indicate that momentum has weakened and the market is digesting prior gains.
This cooling in demand helps explain why bitcoin continues to struggle at the same technical levels. The price has repeatedly encountered resistance near $71,500, while the “Cost basis of recent buyers” (1 week–1 month holders) sits close to $70,000, creating a zone where relief rallies often face selling pressure.
From a positioning standpoint, the key structural levels are relatively clear. $65,000 remains an important support level, a sustained break below would challenge the current base-building process. On the upside, the $70,000–$75,000 range remains critical, particularly given the concentration of options positioning around those strikes. A firm hold above $75,000 would indicate stronger buyer control and an improving market structure.
The derivatives market also suggests that some of the excess speculation has been flushed out. Open Interest has declined, perpetual futures premiums have compressed, and implied volatility has begun to normalize. In other words, the market appears to be reducing the leverage that built up during earlier euphoric phases. Options positioning is increasingly clustering around $75,000, which many traders now view as a potential gamma magnet if spot demand strengthens.
Macro conditions remain an important constraint. Global liquidity has not yet shown clear signs of improvement, and capital continues to rotate toward more defensive assets. Bitcoin also remains meaningfully correlated with equities, meaning a significant drawdown in traditional markets could spill over into crypto.
It is important, however, to distinguish between price stagnation and structural stagnation. While the market is currently consolidating, several long-term adoption trends continue to strengthen beneath the surface.
Institutional attention toward tokenization of financial assets is increasing rapidly, while stablecoins remain the first large-scale real-world use case of blockchain infrastructure. Today, the tokenized asset market represents roughly $20B on-chain, compared with more than $500T across global financial markets. Even modest penetration implies multi-trillion-dollar long-term potential.
As a result, many institutional investors are increasingly framing crypto exposure within this broader structural transformation of financial infrastructure, rather than purely through the lens of short-term market cycles.
Ethereum adds another layer to this setup. “Total Value Locked” currently sits around $300B, near cycle highs when measured in ETH, while activity across core DeFi and institutional applications continues to expand. Valuations have compressed while underlying fundamentals have strengthened, creating potential convexity if broader risk appetite stabilizes.
At the same time, the Ethereum ecosystem is undergoing a deeper reflection about its role. Increasingly, the focus is shifting toward applications that deliver real-world utility, particularly technologies that protect financial freedom and freedom of expression in restrictive environments. If this narrative continues to develop, it could broaden Ethereum’s user base beyond purely financial speculation.
For investors, the key takeaway remains straightforward: flows matter more than headlines, and demand metrics matter more than short-term price movements.
The next sustained move in the market will likely come not from temporary price rebounds, but from confirmed capital inflows and the gradual institutionalization of the asset class.
This communication is for information and education purposes only and should not be taken as investment advice, a personal recommendation, or an offer of, or solicitation to buy or sell, any financial instruments. This material has been prepared without taking into account any particular recipient’s investment objectives or financial situation and has not been prepared in accordance with the legal and regulatory requirements to promote independent research. Any references to past or future performance of a financial instrument, index or a packaged investment product are not, and should not be taken as, a reliable indicator of future results. eToro makes no representation and assumes no liability as to the accuracy or completeness of the content of this publication.