


Analyst Weekly, December 1, 2025
Consumer Stocks: The Sleeper Trade Heading Into 2026
Consumers have looked gloomy on the surface: confidence readings are hovering near cycle lows, layoffs keep making headlines, and affordability stress is real. But under the hood, the US consumer is gearing up for one of the biggest stimulus tailwinds since the pandemic. Retail investors should pay attention.
A Strong Consumer Tailwind Meets Cyclical Risk
Starting February 2026, roughly $150 billion in fresh stimulus is projected to flow into US households through enhanced tax refunds and policy changes. That’s nearly pandemic-level support, and it hits right as households look stretched.
Refund season already packs a punch in normal years. For lower- and middle-income consumers, the most sensitive to cash flow, refunds drive everything from sneakers and electronics to used cars and vacations. Now imagine refund checks almost 45% higher than last year. That could be the spending catalyst the market isn’t fully pricing in.
Sectors and companies most exposed to tax-season behavior? Discount retailers (think companies that cite refund season as a demand driver: $DG, $BURL, $KSS, $TJX, $SCVL, $ROST), autos highly sensitive to refund-related spending ($KMX, $AZO), gaming ($BYD, $DKNG), value travel ($BKNG, $CCL), fast fashion ($NKE, $CROX) and Buy Now, Pay Later (BNPL)-linked names ($AFRM, $AMZN). Many of these companies have openly said their customers respond to refund timing, and they’ve been bracing for a lift.
Investment Takeaway: This consumer boost doesn’t stand alone. When combined with the broader fiscal package for 2026, plus a Federal Reserve that may lower rates and prepare to shift from balance-sheet reduction to gradual expansion, the backdrop could become more supportive for spending and risk assets. Greater liquidity and lighter tax burdens tend to benefit smaller, consumer-sensitive companies in particular. The main risk to this outlook is straightforward: if employment weakens more than anticipated, the spending lift from refunds and tax changes may not fully materialize. Investors should balance that tailwind against employment and fiscal-timing risks as they position portfolios.
Consumers Feel Down, but They Haven’t Stopped Spending
Consumer sentiment surveys are sitting at levels typically associated with economic slowdowns. Yet actual spending patterns and corporate earnings tell a different story. Many large US companies continue to report rising profits, showing that demand has held up better than the mood would suggest.
That disconnect between how consumers report feeling and how they are actually spending has been a notable feature of this cycle. Historically, gaps like this tend to narrow over time — sometimes because sentiment eventually improves, and other times because spending slows to match the softer mood. At this stage, spending data and corporate results indicate that consumer activity has held up better than sentiment surveys might imply, though it remains uncertain how long that resilience will persist.
Meanwhile, small-cap US stocks are trading at unusually steep valuation discounts to large caps, levels not seen in many years. Those depressed valuations reflect low expectations. If consumer activity steadies or improves, smaller companies, which are more sensitive to shifts in household demand, could see outsized upside because the bar for good news is so low.
Investor Takeaway: For investors who think the consumer is strained but not collapsing, this backdrop may create a potentially attractive environment for selective exposure within consumer-linked areas of the market. Large, liquid beneficiaries could include $AMZN, $AAPL, $NKE, $TMUS, $BKNG, $CCL, while small caps may offer optionality if spending stabilizes.
Bitcoin Is Starting to Behave Like a Large-Cap Asset
Recent data from Ecoinometrics points to a notable shift in how bitcoin trades. Historically, its downside and volatility were driven mostly by macro cycles and on-chain activity.
Today, the picture is more mixed: ETF flows have become a central part of the pricing mechanism, giving bitcoin characteristics that look increasingly similar to a traditional institutional asset.
A narrower trading range signals a different market structure
In a base-case environment where ETF outflows stabilize, bitcoin appears comfortable in a relatively contained range: roughly around $72k to $85k. Earlier cycles rarely produced that kind of consistency. Its trading dynamics now reflect a broader, more diversified investor base.
Three structural changes are driving this behavior:
- Volatility has moderated over the past several years, making bitcoin’s profile resemble that of a large-cap risk asset more than an early-stage technology bet.
- The “digital gold” narrative has encouraged greater institutional participation through regulated ETF vehicles.
- Liquidity has deepened via regulated stablecoins and frameworks like Genius & MiCA, reducing friction in the broader ecosystem.
These factors together create what could be described as a more balanced trading environment, not immune to swings, but less dependent on crypto-native catalysts alone.
However, flow-driven markets cut both ways
A secondary scenario also matters. If ETF outflows persist, the pressure on price would come less from crypto-specific concerns and more from the mechanics of the flow structure itself. Under that setup, a move toward $60k over a relatively short window is plausible. Not because of panic, but because large vehicles can magnify directional moves when flows turn.
Investor takeaway: Bitcoin is moving into a regime where traditional market variables such as liquidity, regulation, fiscal conditions, and institutional sentiment, carry as much weight as on-chain signals. For investors, this means a potentially more predictable asset than in past cycles, but also one more sensitive to shifts in ETF demand and broader risk appetite.
It’s less about forecasting a specific price path and more about understanding the market structure now shaping bitcoin’s trading behavior.
EURUSD: Lift from the Support Zone – What Matters Now
EURUSD rose 0.74% last week to 1.1602. The pair recently turned just below the 1.15 level, right within a long-term support zone (Fair Value Gap) on the daily chart. The broader uptrend remains intact, but the medium-term structure still shows a series of lower highs and lower lows. A sustained breakout above 1.1668 would be needed to break this pattern. If that fails, the pair risks slipping back into the mentioned support zone.
Tension is rising this week, as the economic calendar is packed with important data releases from the US and Europe. Volatility is almost guaranteed.
- Monday: US ISM Manufacturing PMI – will the index remain below the critical 50 mark?
- Tuesday: Eurozone inflation data – expected to rise to 2.2% YoY, still close to the ECB’s target.
- Wednesday: US ISM Services PMI – key to assessing whether the services sector remains strong.
- Thursday: Eurozone retail sales – an important indicator of consumer sentiment and an early signal for the upcoming holiday season.
- Friday: Core PCE Price Index – the Fed’s preferred inflation measure, keeping markets on edge until the end of the week.
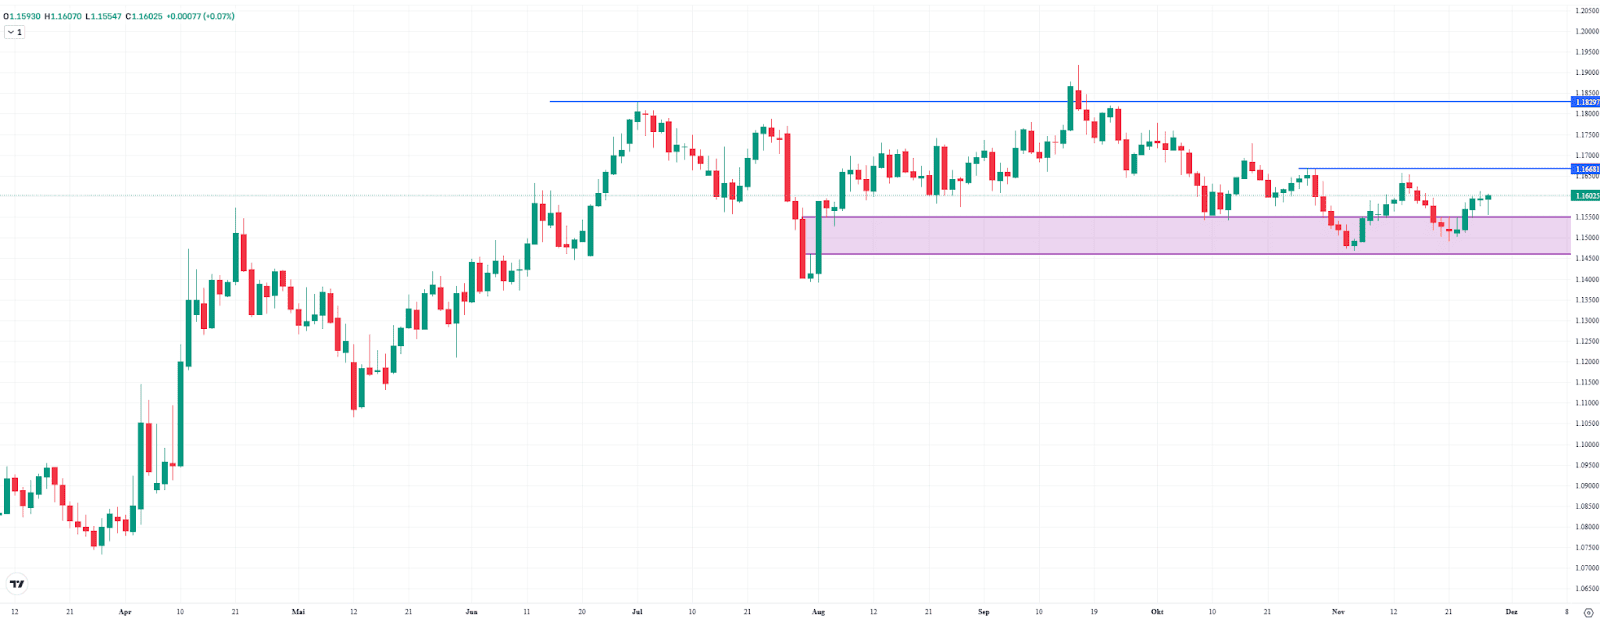
EURUSD, daily chart. Source: eToro
Alphabet at a Record High: How Much Further Can the Trend Go?
Alphabet’s share price posted strong gains last week, rising 7.1% to $320.12. At one point, it even climbed to $332.14, a new all-time high. Technically, many factors point to a continuation of the trend. At the same time, the upward move is now stretched. Since the April low, Alphabet has gained around 125% without any meaningful pullbacks.
This increases the likelihood of short-term profit-taking. If a counter-move occurs, two support zones (Fair Value Gaps) are particularly important:
- $294.48–$304.54 — a decline into this area would be a healthy correction within the uptrend.
- $262.10–$273.00 — a drop into this zone would resemble a bear-market scenario.
In short: The long-term uptrend remains intact, but the risk of a pullback is rising.

Alphabet, weekly chart. Source: eToro
This communication is for information and education purposes only and should not be taken as investment advice, a personal recommendation, or an offer of, or solicitation to buy or sell, any financial instruments. This material has been prepared without taking into account any particular recipient’s investment objectives or financial situation and has not been prepared in accordance with the legal and regulatory requirements to promote independent research. Any references to past or future performance of a financial instrument, index or a packaged investment product are not, and should not be taken as, a reliable indicator of future results. eToro makes no representation and assumes no liability as to the accuracy or completeness of the content of this publication.