


The Daily Breakdown uncovers what to focus on as we start off Q2 on shaky ground due to surging oil prices and geopolitical worries.
Before we dive in, let’s make sure you’re set to receive The Daily Breakdown each morning. To keep getting our daily insights, all you need to do is log in to your eToro account.
What’s Happening?
Thanks to a rebound on March 31, Q1 didn’t end as badly as it once appeared. Still, the S&P 500 fell 4.6% for the quarter — its worst quarter since the 2022 bear market — while the Nasdaq 100 entered correction territory, defined as a decline of 10% or more. Bitcoin also extended its bear-market lows.
However, there were a few positives.
First, BTC snapped its five-month skid and finished March slightly higher. Stocks have also shown some stability over the past two days. Unfortunately, oil prices continue to rise, while geopolitical concerns are adding to the uncertainty as the second quarter begins.
👀 Q2 Outlook
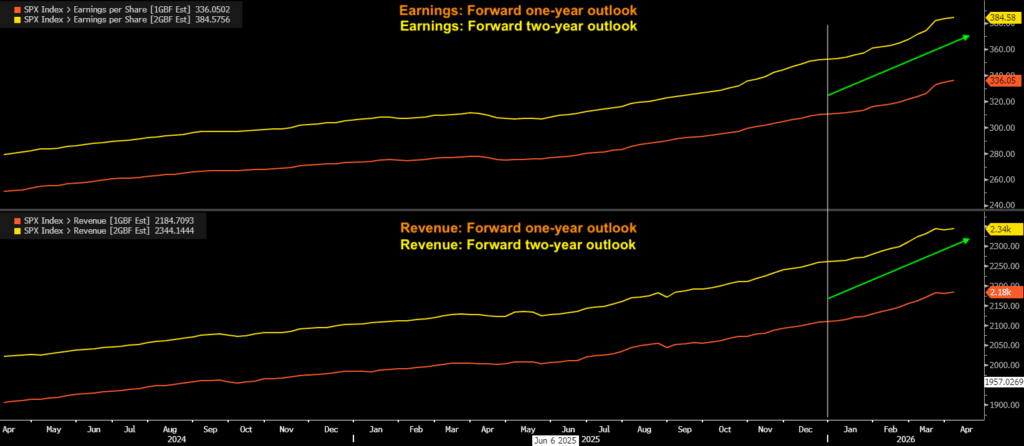
There are classic market dynamics unfolding right now: price action and fundamentals are moving in opposite directions. Stocks have been under pressure, yet earnings estimates have not only held steady but continued to rise through the first quarter.
Earnings season is set to begin in mid-April with major banks such as JPMorgan, Bank of America, Wells Fargo, and Citigroup. Investors will also hear from oil-sensitive companies like Delta Air Lines, United Airlines, and Exxon Mobil, as well as consumer-facing firms such as PepsiCo and American Express.
Analysts currently expect earnings growth of 16% to 17% in 2026. While the Q1 results will matter, management outlooks will be even more important. Those projections will have the greatest influence on full-year estimates, and markets are almost always more focused on what lies ahead than on what has already happened.
If those outlooks support current estimates — and those estimates remain steady or move higher as a result — the bear case becomes more difficult to justify. On the other hand, if management teams suspend guidance, warn of a weakening consumer, or cut their forecasts, estimates will likely move lower. That would force investors to ask whether the market has sold off too much, just enough, or still has further to fall.
Want to receive these insights straight to your inbox?
The Setup — S&P 500 Valuation
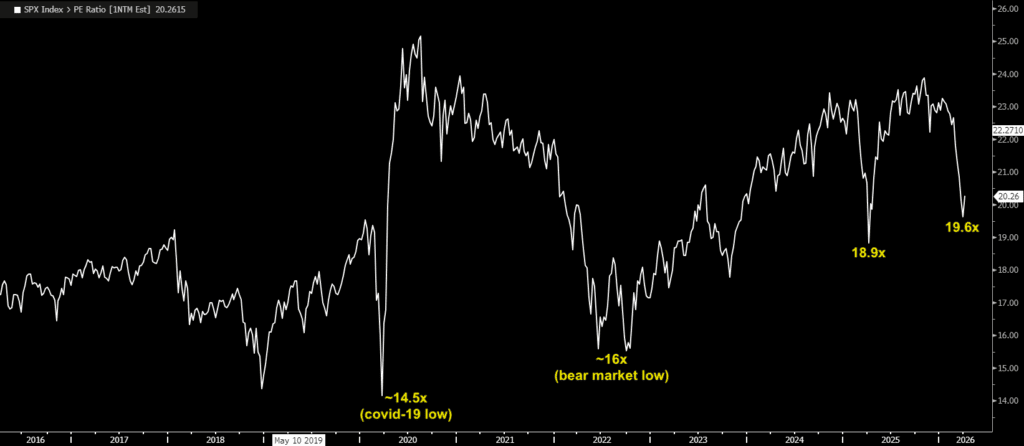
One of the most widely used valuation metrics is the price-to-earnings ratio, or P/E.
It is a simple equation — price divided by earnings — and for an asset’s valuation to come down, either price must fall or earnings must rise. Right now, both are happening.That helps explain why the recent forward P/E low nearly matched the Liberation Day low from about a year ago, even though the S&P 500 has only fallen about half as much.
🔧 Understanding Market Mechanics
Here’s the reality: price tends to move before the fundamentals. Markets usually bottom before fundamentals reach their trough, and they often peak before fundamentals hit their high. From that perspective, some investors may believe the current selloff is only the beginning.
At the same time, markets also tend to overreact — both during euphoric periods, when it feels like nothing can go wrong, and during panics, when it feels like everything is falling apart.
Earnings season should help clarify which environment investors are dealing with now and may help answer the key question: Have markets sold off too much, just enough, or do they still need to move lower?
The Bottom Line: Since 1974, the S&P 500 has averaged three pullbacks of 5% or more per year and roughly one correction of 10% or more every 10 months, while the average intra-year decline is about 14%. In other words, this is normal market behavior — so far. It gives investors a chance to review their strategy and assess their risk tolerance. If they remain comfortable with both, the current pullback may present an opportunity to dollar-cost average. If not, it may be time for investors to reassess their portfolio allocation.
What Wall Street’s Watching
XLE
The energy sector ETF — the XLE — was the top-performing sector in the S&P 500 in Q1, rising 37%. Earnings estimates have surged for this group, with consensus expectations calling for roughly 26% growth in 2026 (vs. -1% growth about a month ago). Tech still leads the pack when it comes to earnings growth estimates though, although the sector was the third-worst performer in Q1.
SNDK
With its 167.6% return, SanDisk was the top-performing stock in the S&P 500 in Q1. Shares surged higher alongside other semiconductor and memory players, like Western Digital and Micron. On the flip side, AppLovin was the worst-performer in the S&P 500, falling 40.9% in Q1.
Disclaimer:
Please note that due to market volatility, some of the prices may have already been reached and scenarios played out.