


Analyst Weekly, February 16, 2026
Software just had its worst non-recession slump in 30 years. Over the past 12 months, the group has fallen more than 30% at its worst point which is the deepest drawdown outside of a recession in three decades. Roughly $2 trillion in market value has been erased, and Software’s weight in the S&P 500 has dropped from 12% to 8.4%.
What spooked the market?
Two forces hit at once:
- AI anxiety. Investors began pricing in a scenario where new large language models would cannibalize traditional software faster than incumbents could adapt.
- Technical capitulation. De-risking accelerated. Short interest in large-cap software moved toward cycle highs. Sentiment turned decisively bearish. Selling became broad: quality names and speculative growth alike were hit.
The market effectively priced in a “worst-case AI disruption” narrative.
But, fundamentals did not collapse
Consensus expectations for 2026 still call for:
- ~16% sales growth; ~17% earnings growth
- Slight margin expansion
Recent earnings support that resilience:
- Every S&P 500 Software company reporting so far beat earnings.
- Revenue beats are running above recent averages.
- Growth remains solid double-digit.
Meanwhile, valuations have compressed materially:
- Forward P/S multiples have fallen by roughly 4 turns.
- Forward P/E has dropped by more than 10 points.
- Current multiples sit near levels seen during prior market stress episodes.
In other words, prices have reset faster than fundamentals.
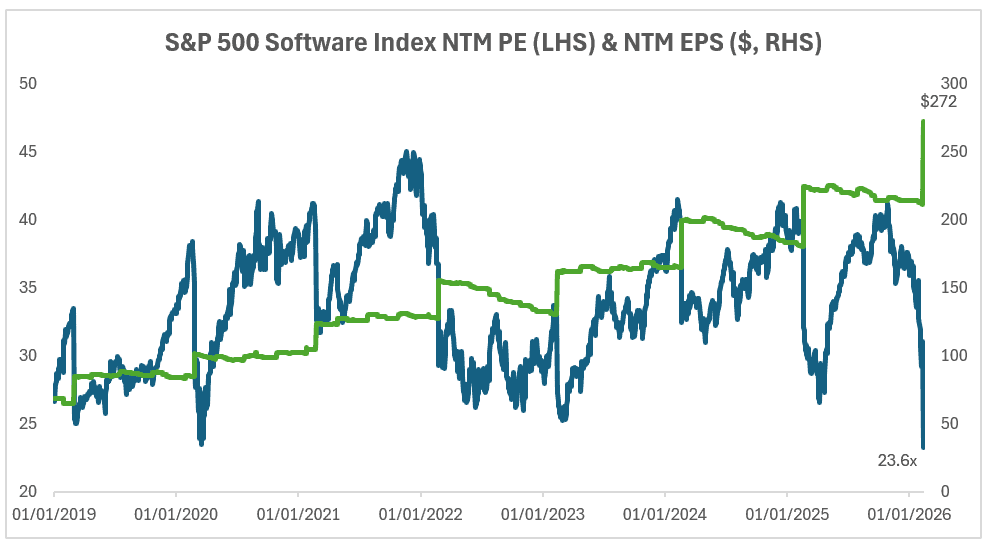
Source: Bloomberg. Data as of February 15, 2026.
AI: threat or tailwind?
In our view, the near-term reality is more nuanced than the headlines.
Enterprise software is embedded in multi-year contracts with high switching costs. AI tools are increasingly being layered into workflows rather than replacing them outright. In many cases, AI looks additive, creating cross-sell and upsell opportunities, and not immediately disruptive.
Longer term, the structure of the industry may evolve. But over the next 3 to 6 months, the market may have discounted a disruption curve that is too aggressive.
Why this matters for investors
For investors, this setup creates two angles:
- Tactical rebound potential: Extreme pessimism & short positioning & earnings season imply a fertile ground for sharp reversals if results or guidance challenge the bearish narrative.
We are watching upcoming catalysts:
- A busy calendar of software earnings in the coming weeks.
- Investor days where management teams can directly address AI concerns.
If positioning resets, rebounds can be swift, especially in higher-quality segments like cybersecurity and mission-critical enterprise platforms.
- Longer-term quality exposure at lower entry points: Many large-cap software companies still generate strong free cash flow, maintain durable customer bases, and are increasing buybacks. In fact, buyback execution in software has grown meaningfully over the past two years, which could provide additional support at depressed valuations.
Some companies are seen to be relatively more insulated due to their positioning within enterprise systems, security infrastructure, or vertical niches. Here’s how that landscape breaks down.
Enterprise & Mission-Critical Platforms
These platforms sit at the center of enterprise architecture. Their products are often tied to multi-year contracts, mission-critical workflows, and high switching costs; factors that can moderate near-term displacement risk. Here, we have companies such as:
- Microsoft (MSFT): Azure continues to scale as a foundational cloud and AI infrastructure layer.
- ServiceNow (NOW): Workflow automation platform embedded across large enterprises.
- Oracle (ORCL): Database and cloud infrastructure backbone with AI capabilities layered in.
- SAP: Core ERP systems deeply integrated into global corporate operations.
Cybersecurity
Security spending is typically viewed as essential rather than discretionary. AI tools are increasingly being incorporated into threat detection and response, suggesting integration rather than replacement in the near term. Here, we have companies such as Palo Alto Networks (PANW);CrowdStrike (CRWD); Zscaler (ZS); Okta (OKTA); SentinelOne (S).
Data & Infrastructure
As AI adoption expands, demand for data storage, processing, monitoring, and secure connectivity remains central to enterprise operations. Infrastructure layers often scale alongside application-level innovation. Here, we have companies such as Snowflake (SNOW); Datadog (DDOG); Twilio (TWLO); Check Point (CHKP)
Application & Vertical Software
Vertical software providers often operate in specialized industries with regulatory complexity and customized workflows. Long contract durations and domain-specific integration can contribute to revenue visibility. Here, we have companies such as:
- Tyler Technologies (TYL): Public sector software provider.
- Guidewire (GWRE): Insurance core systems.
- SailPoint (SAIL):Identity governance solutions.
- JFrog (FROG): DevOps and software supply chain tooling.
- Q2 Holdings (QTWO): Digital banking software.
- CoStar (CSGP): Real estate data and analytics platform.
Across all these categories, the common thread is structural embeddedness: systems that enterprises rely on daily. While AI is reshaping software broadly, the degree and speed of disruption may vary significantly depending on how central a platform is to operational infrastructure.
Investment Takeaway: The market is pricing in severe AI disruption. The data, so far, shows resilient growth and earnings beats. Further downside cannot be ruled out as volatility remains elevated. But in our view, the risk/reward profile has shifted. When sentiment is this negative and fundamentals remain intact, the balance of risks often begins to favor recovery rather than continued collapse. For retail investors, the key question is not whether AI changes software: it will, but not uniformly. The question is whether today’s prices already assume too much damage, too soon.
Big in Japan: The Comeback Trade Nobody’s Crowded Into
For years, Japan was the market equivalent of “seen at 9:41pm.” Investors glanced… then went back to the S&P 500.
But 2026? Different vibe.
Start with valuations. While US stocks trade north of 20x earnings, Japan’s sitting closer to the mid-teens. Not distressed. Not bubbly. Just… cheaper. And earnings are actually improving.
Then there’s reform energy. The Tokyo Stock Exchange has been nudging companies trading below book value to shape up: boost returns, improve governance, unlock value. In other words, corporate Japan is being pushed to act more shareholder-friendly.
Policy’s shifting too. Japan is finally exiting ultra-easy money mode. That means higher yields and a firmer yen; which sounds dramatic, but really signals something healthier: normalization. After decades of deflation fears, Japan is reflating.
Finally, positioning. Domestic investors are still underweight equities. Add in global supply chains diversifying away from China, and Japan suddenly looks strategically relevant again.
So no, we do not think this is a late-cycle melt-up story.
It’s a reform, reflation, and reasonable valuation story.
Palo Alto Networks Defends Support – Earnings in Focus
Palo Alto Networks shares recovered 4.9% last week to $166.95. The technical trigger was the successful defense of the support zone (Fair Value Gap) between $151.20 and $154.40 in the prior week. This area has already acted as a support zone twice over the past two years.
The rebound reduced the distance to the record high to around 25%, after the drawdown had temporarily widened to 32%.
Quarterly earnings are due after the close on Tuesday. They are likely to determine whether the recovery continues or whether the long-term support zone will face another test.
To sustainably improve the chart picture, a move above the interim high at $188.80 would be required – this is where the most recent selling wave began. The 20-week moving average, currently near $186, is also located in this area. A break back above this level could attract additional buyers, but both resistance levels would need to be cleared decisively.
On the downside, the next relevant support zone lies between $133.80 and $140.10.
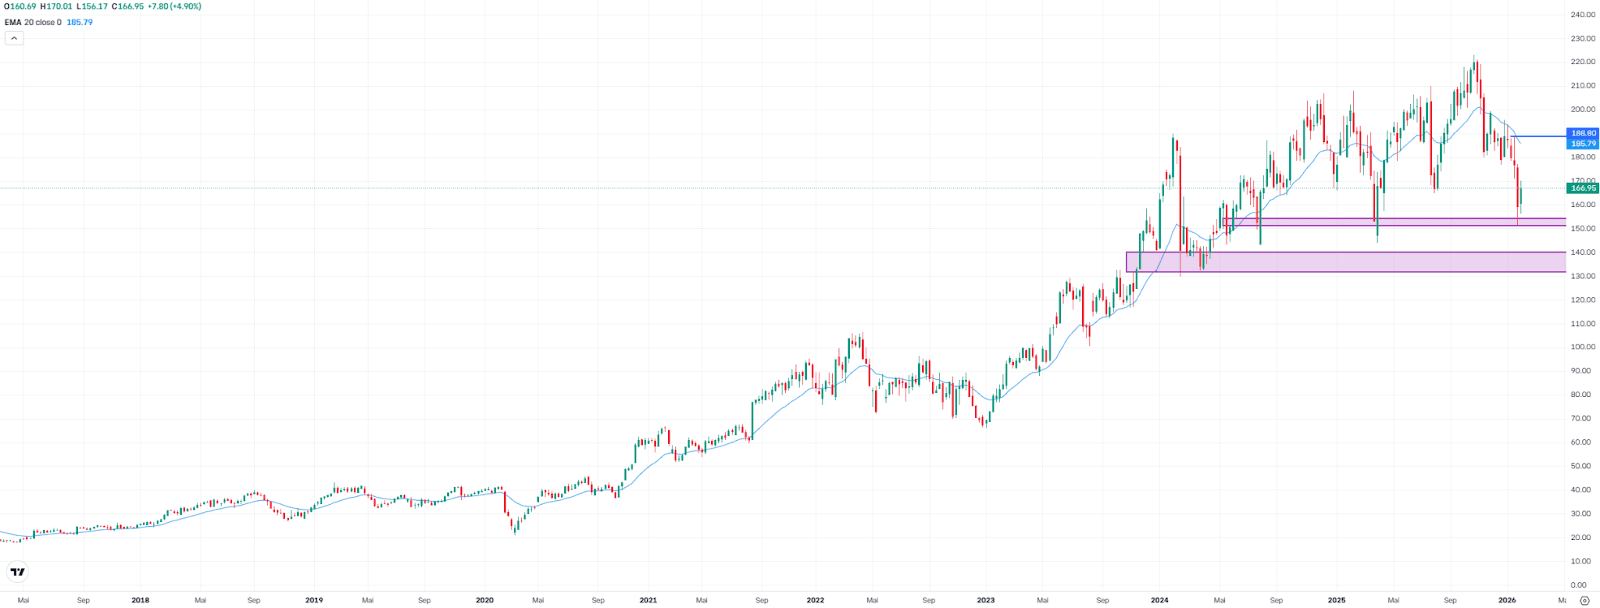
Palo Alto Networks, weekly chart. Source: eToro
USDJPY Posts Strongest Weekly Decline Since November 2024
USDJPY fell 2.8% last week to 152.75, marking its strongest weekly decline since November 2024. Back in January, buyers had already failed at a long-term resistance zone, a Fair Value Gap between 158.85 and 160.33. A similar pattern occurred in early 2024.
Last week, the pair not only reversed lower but also dropped below the 20-week moving average, currently at 154.39. This signals a short-term shift in direction and increases the likelihood of further declines (see blue rectangles in the chart).
From a broader perspective, the area around 141 comes into focus as a potential downside target. Since 2023, this zone has been tested multiple times and repeatedly acted as support.
However, if the pair climbs back above the 20-week moving average, another test of the resistance zone between 158.85 and 160.33 would be possible. For now, the technical setup points to continued selling pressure.
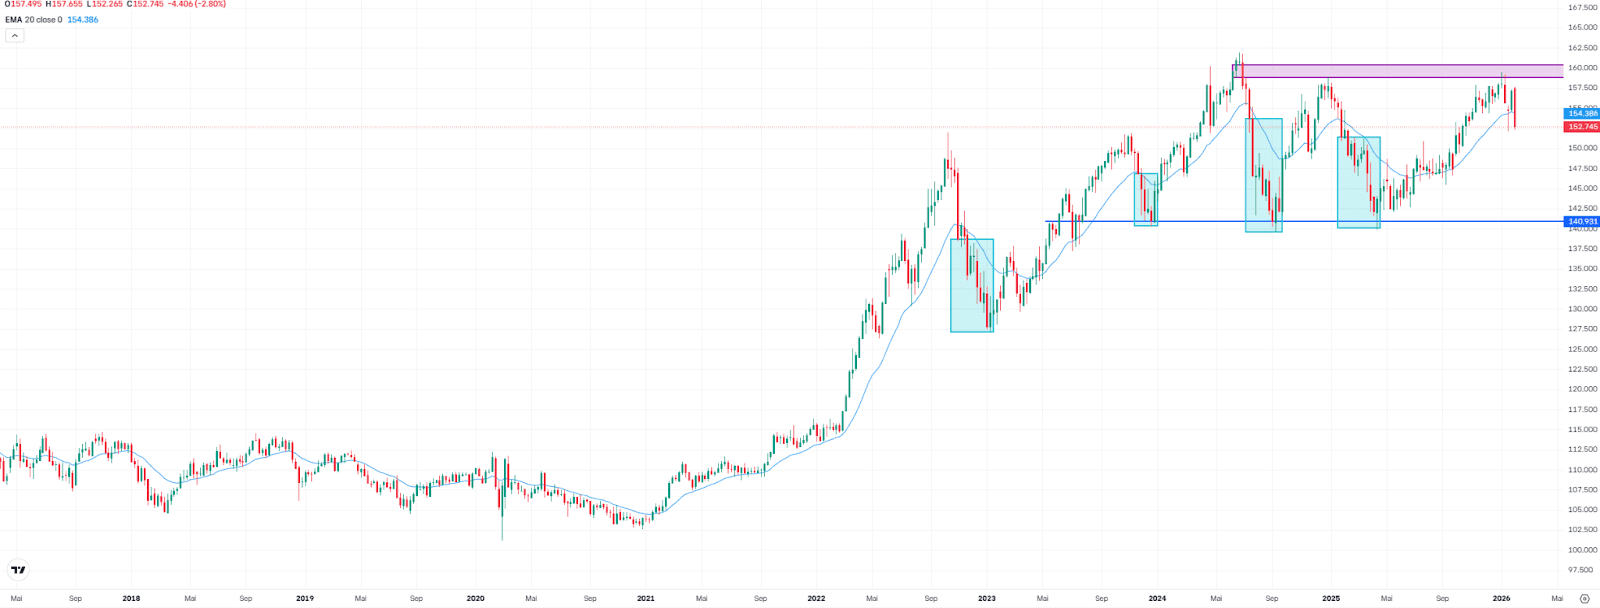
USDJPY, weekly chart. Source: eToro
BTC in a Delicate Adjustment Phase
Bitcoin enters a new week in a delicate phase. The correction from the October highs is around 50%, and although we have seen technical rebounds from the $60,000–62,000 USD area, structural data still do not show clear signs of a definitive bottom.
The most striking move occurred on February 5, when the market recorded approximately $5.4 billion in realized losses in a single day. It was the largest loss realization event since March 2023. At first glance, it could be interpreted as capitulation. However, when the lens is widened, the context changes.
Cumulative losses measured in BTC terms are around 0.3 million. During the 2022 bear market, that figure exceeded 1.1 million BTC. In other words, the adjustment has been significant, but it still does not reach structural cleansing levels comparable to previous cycle bottoms.
Classic cycle metrics reinforce that reading. MVRV has not entered extreme undervaluation territory. NUPL does not reflect unrealized loss levels typical of deep capitulation. Approximately 55% of total supply remains in profit, whereas at historical lows that percentage approached 45–50%. In addition, price continues to trade above the realized price (the average purchase price of all BTC holders), located around $55,000 — a level that in previous cycles was clearly breached before a base was formed.
Market bottoms are rarely isolated one-day events. They are processes that require time, volatility compression, and emotional exhaustion.
At the same time, the macro environment remains decisive. Expectations of higher rates for longer continue to limit risk appetite. Until there are clear signs of monetary easing, it is difficult for flows to return with sustained strength to the assets most sensitive to liquidity, such as bitcoin.
On the institutional front, ETFs have recorded weekly outflows of approximately $360 million. It is not a disorderly figure nor comparable to systemic panic episodes, but it confirms that structural buying flows have not yet returned decisively. Nor are we seeing massive liquidations from long-term investors, suggesting the market is in an adjustment phase rather than a collapse. All of this paints a clear picture: the market has corrected sharply, cleaned part of the excess, but still does not display the classic symptoms of a mature bottom.
This does not necessarily imply that another abrupt decline must occur. It means the process may extend over time. Consolidation phases following major bull cycles are typically prolonged and require gradual rebuilding of confidence and flows.
For the investor, the message is more strategic than tactical. It is not about anticipating the exact bottom, but about understanding the context. In the absence of clear structural capitulation signals and with a still-restrictive macro environment, prudence remains coherent in the short term.
At the same time, the correction has already significantly reduced valuations from the highs, which begins to open windows for gradual accumulation on longer horizons, provided one assumes volatility will remain present.
The week ahead will likely not define the cycle. But it may provide clues about the speed of the adjustment and the resilience of support around the $60,000 area. In markets like this, discipline and patience are often more profitable than the rush to anticipate the turn.
This communication is for information and education purposes only and should not be taken as investment advice, a personal recommendation, or an offer of, or solicitation to buy or sell, any financial instruments. This material has been prepared without taking into account any particular recipient’s investment objectives or financial situation and has not been prepared in accordance with the legal and regulatory requirements to promote independent research. Any references to past or future performance of a financial instrument, index or a packaged investment product are not, and should not be taken as, a reliable indicator of future results. eToro makes no representation and assumes no liability as to the accuracy or completeness of the content of this publication.