


Analyst Weekly, March 16, 2026
Markets had a rough realization lately: the playbook investors relied on for decades has not been working the way it used to. Traditionally, when equities fall, government bonds rally, cushioning portfolios. But with the Middle East conflict driving oil volatility and inflation fears, both sides of the classic balanced equity/bond portfolio have been falling together.
That shift is forcing investors to rethink where safety actually sits. Markets may be moving into a different regime, one where energy shocks, policy constraints, and real assets matter more than traditional diversification.
When bonds stop hedging stocks
The policy backdrop is a major reason traditional portfolio hedges are failing.
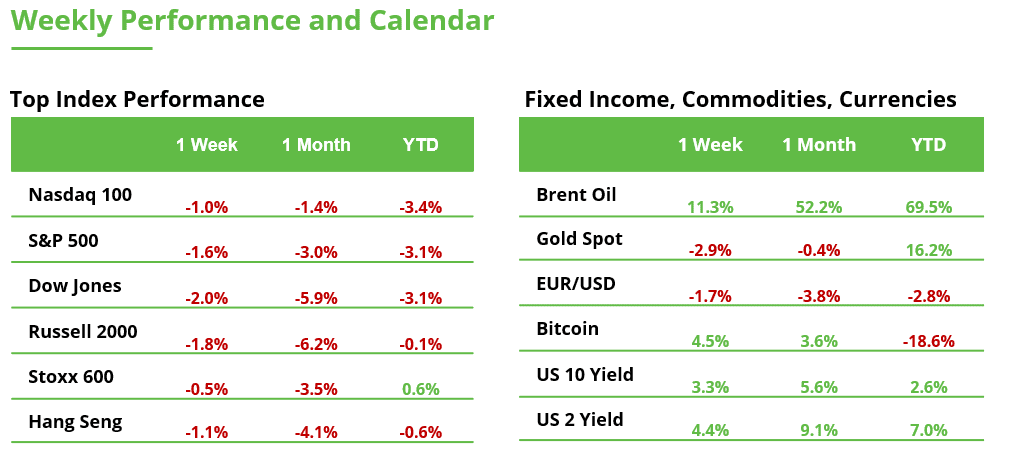
Since the Middle East conflict started, both equities and government bonds declined. US two-year yields rose by more than 35 bp even as stocks fell; the opposite of what investors usually expect during risk-off periods.
The reason is simple: if inflationary pressures rise because of higher energy prices, central banks can’t immediately cut rates to support growth. Without that policy cushion, bonds lose their usual defensive role.
That has pushed investors to look elsewhere for diversification.
Managed futures are quietly outperforming
One strategy gaining attention is managed futures, often known as CTA strategies. These funds use trend-following models across commodities, currencies, and interest rates.
During the 2022 market sell off, several managed futures ETFs, such as $DBMF, $CTA, $KMLM, and $FMF have delivered gains between 14% and 48%, while equities and 60/40 portfolios posted double digit negative returns.
Investment Takeaway: The key advantage of managed futures is their low correlation to stocks and bonds, making them one of the few strategies that have effectively diversified portfolios during periods of volatility.
Assets tied to the Strait of Hormuz trade corridor
In the commodities space, investors are also paying closer attention to supply-chain vulnerabilities, especially shipping routes in the Middle East. Assets tied to the Strait of Hormuz trade corridor, including crude oil, liquefied natural gas, aluminum and agricultural commodities such as soybean oil and grains, have seen rising demand as investors hedge against potential supply disruptions.
The dollar is regaining safe-haven status
Currency markets are also shifting. Before the Middle East conflict escalated, investors were positioned for US dollar weakness. Instead, the dollar has rallied, reflecting its traditional safe-haven role.
Some investors are increasing cash and dollar exposure while waiting for markets to stabilize.
Investment Takeaway: If oil prices remain elevated, the combination of higher inflation and cautious central banks could reshape portfolio strategy. For investors, that means diversification may rely less on traditional stock-bond balances and more on real assets, commodities, currency positioning, and alternative strategies.
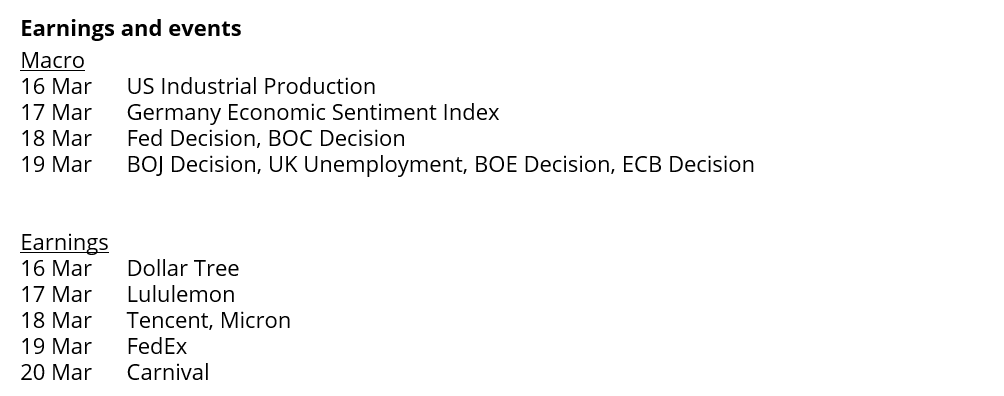
The Fed is likely to wait
Historically, true energy shocks are shown to occur when oil trades more than 50% above its two-year average for several months. By that metric, oil would need to rise closer to $150 per barrel to match the magnitude of past disruptions.
Still, even at current levels, the impact shows up quickly in inflation data. Higher energy prices often act like a tax on consumers, pushing inflation higher in the near term while ultimately slowing growth as households divert spending toward fuel and away from discretionary purchases. If sustained, that creates a difficult environment for central banks.
Because this appears to be a supply-side shock rather than demand-driven inflation, the Fed may look through some of the near-term price pressure. Policymakers typically focus on whether higher energy costs feed into broader inflation expectations or instead slow growth by reducing consumer spending. So far, market-based long term inflation expectations have risen only modestly, reinforcing the case for a cautious response.
We expect the Fed to hold rates at 3.5–3.75% at this week’s meeting. The more important signal will come from the Fed’s dot plot, which shows policymakers’ interest rate projections. While markets currently price only about one cut, some policymakers could indicate a greater willingness to ease if higher energy prices begin to slow growth and weaken the labor market.
Either way, the message is clear: policy will likely remain restrictive for now, with the Fed waiting for clearer evidence on how the energy shock affects growth and inflation. As our US investment analyst Bret Kenwell notes, “the Fed is already dealing with sticky inflation and slowing growth, and the recent surge in energy prices hasn’t yet fully shown up in the CPI or PCE data.”
China ETF Stabilizes After Correction
The iShares MSCI China ETF (MCHI) rose 2.0% last week to $57.78. Already in the previous week, the fair value gap between $55.24 and $57.42 was successfully defended. The index is now trading above the upper boundary of this zone again.
At one point, the ETF was about 17% below the September high of $67.27. The decline can therefore be classified as a moderate correction. Since 2024, the market has maintained a structure of higher highs and higher lows.
From a technical perspective, this points to a potential continuation of the trend, at least as long as the mentioned zone is not broken to the downside. A move back above the 20-week moving average, currently at $60.52, could serve as an additional confirmation for buyers. The most important support remains the April low at $44.63.
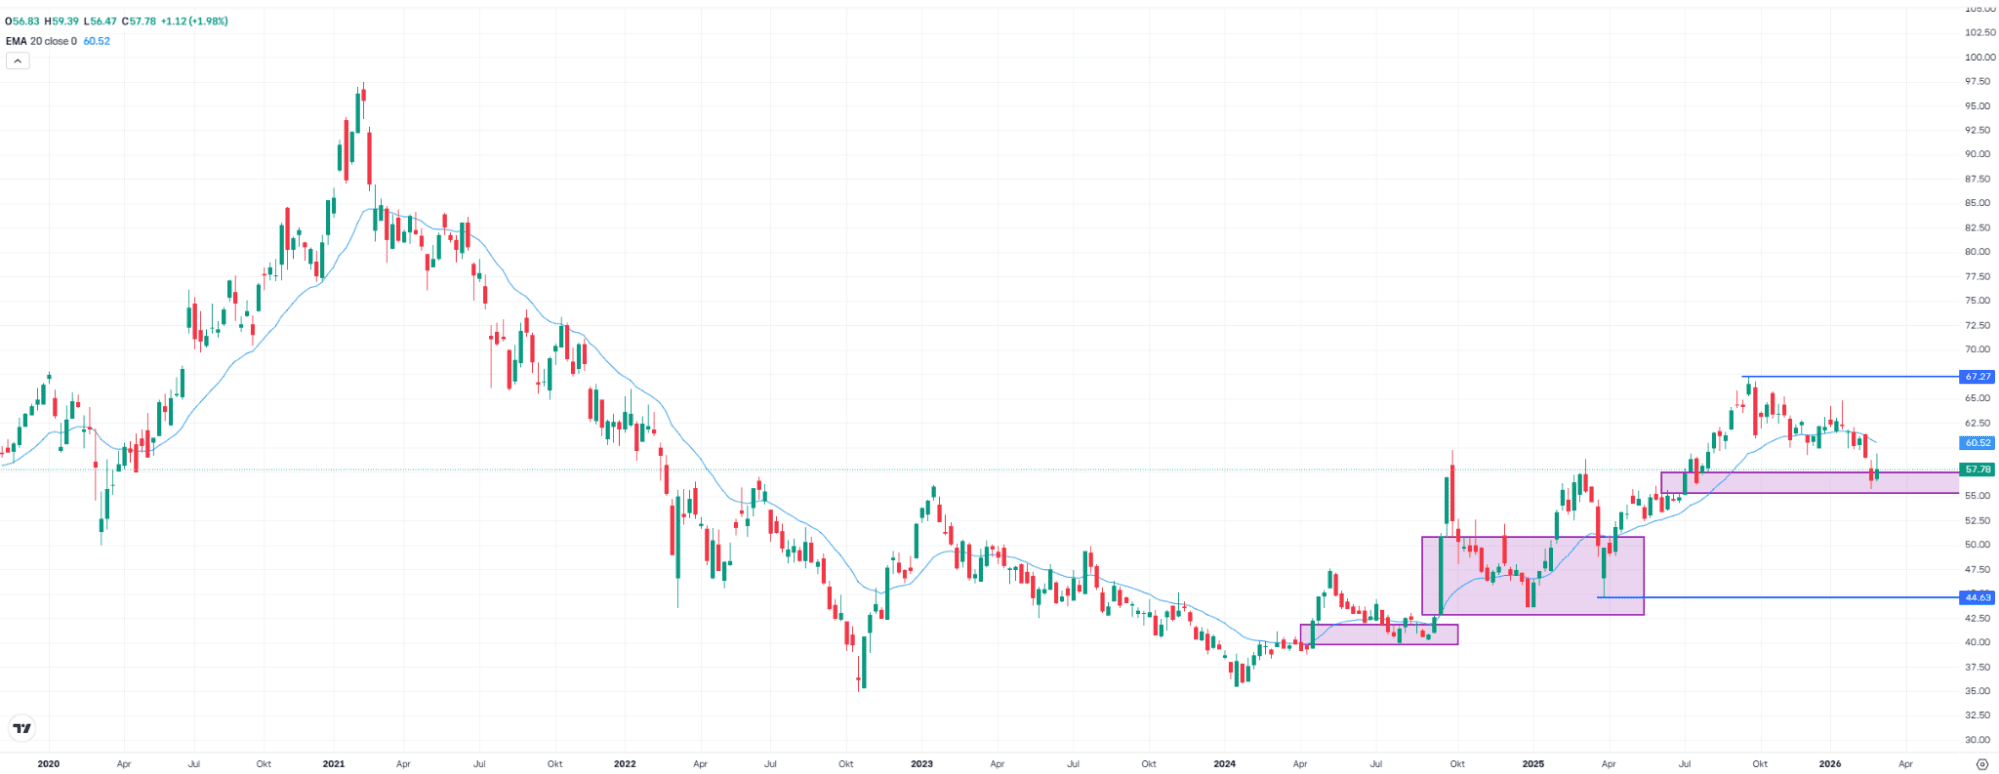
iShares MSCI China ETF, weekly chart. Source: eToro
EUR/USD Technical Check: Key Level Broken
This week could be decisive for EUR/USD, with the Fed interest rate decision on Wednesday and the ECB decision on Thursday. Last week, the currency pair fell another 0.7% to 1.1414. As recently as January, the pair briefly traded close to 1.21, the highest level since 2021.
However, the breakout above the September high at 1.1918 turned out to be a false breakout. Since June, there have been numerous touchpoints around an intermediate high at 1.1494, but this level ultimately failed to prevent a deeper decline.
Following this break, further US dollar strength could push the pair toward the May low at 1.1065. Only a sustained move back above 1.1494 would improve the short-term technical outlook.
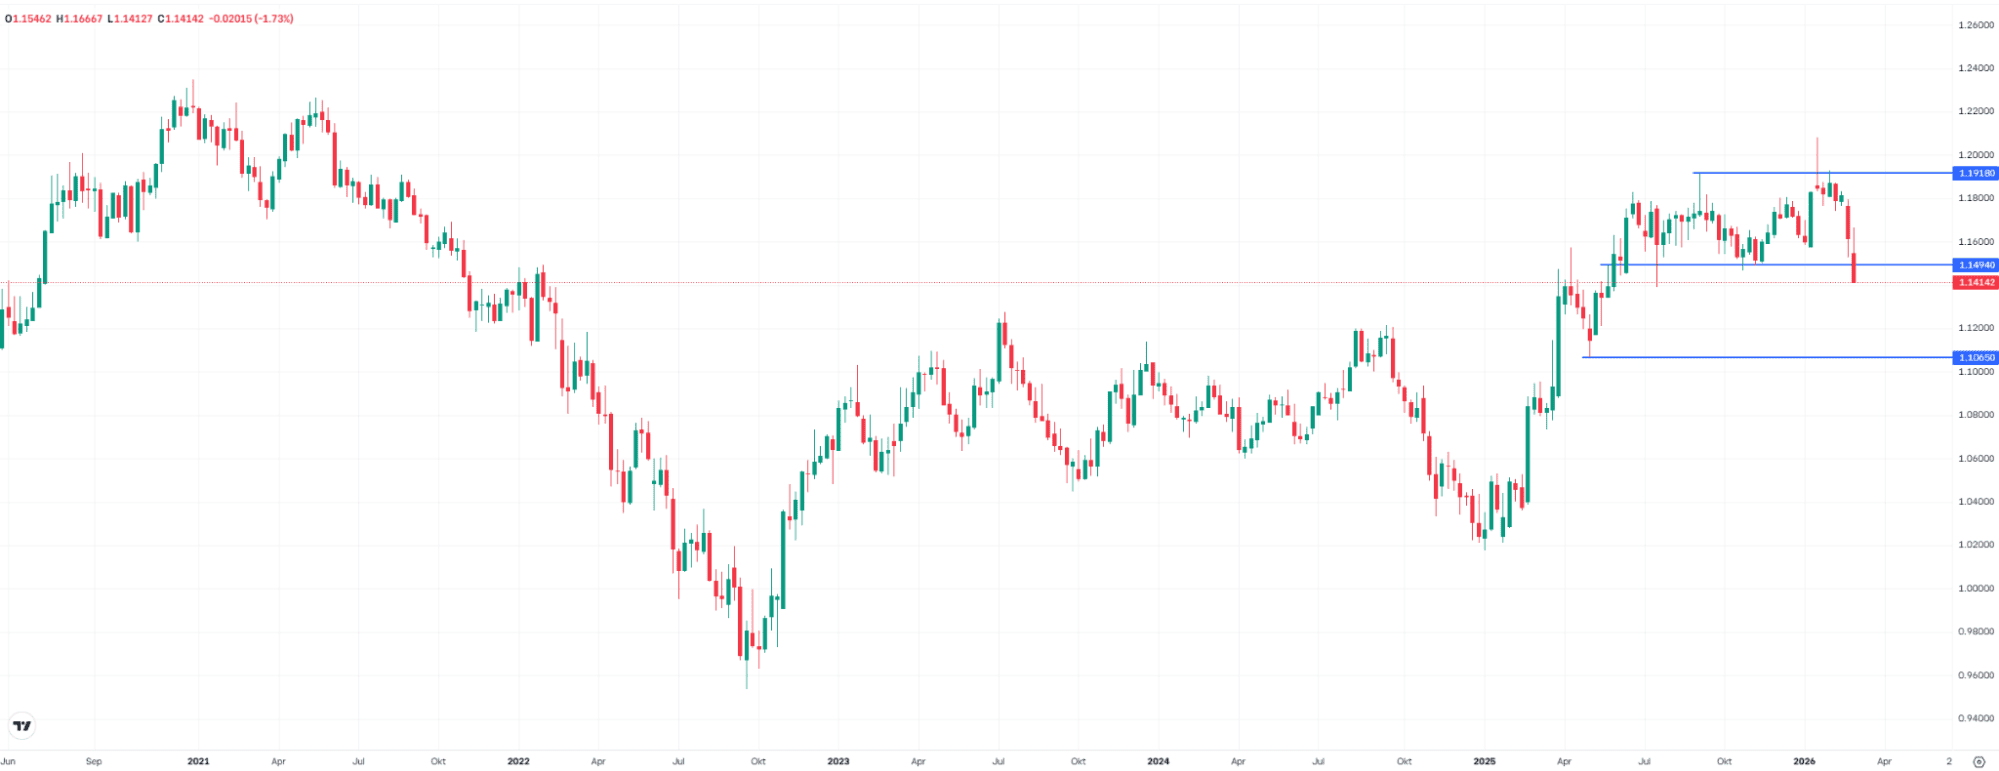
EUR/USD, weekly chart. Source: eToro
FedEx Ahead of Earnings: A Test for the Economic Barometer
FedEx shares ended last week down 2.0% at $351.70. The stock is now trading more than 10% below its record high, placing it in correction territory. Despite this pullback, the stock has gained more than 80% since the April low, at times nearly doubling.
FedEx will release new earnings and updated guidance after the close on Thursday. Why is this important for investors? FedEx is widely viewed as a barometer for the global economy due to its global reach, early indication of trade and shipping activity, and broad customer base.
The long-term uptrend remains intact, and new higher highs are possible, provided FedEx does not send warning signals to the market. Otherwise, the current correction could deepen. A potential target would be the lower boundary of the previously formed fair value gap between $322.19 and $359.46.
A second, narrower support zone lies between $310.84 and $314.53. These areas currently represent the most important potential support zones within the longer-term uptrend.
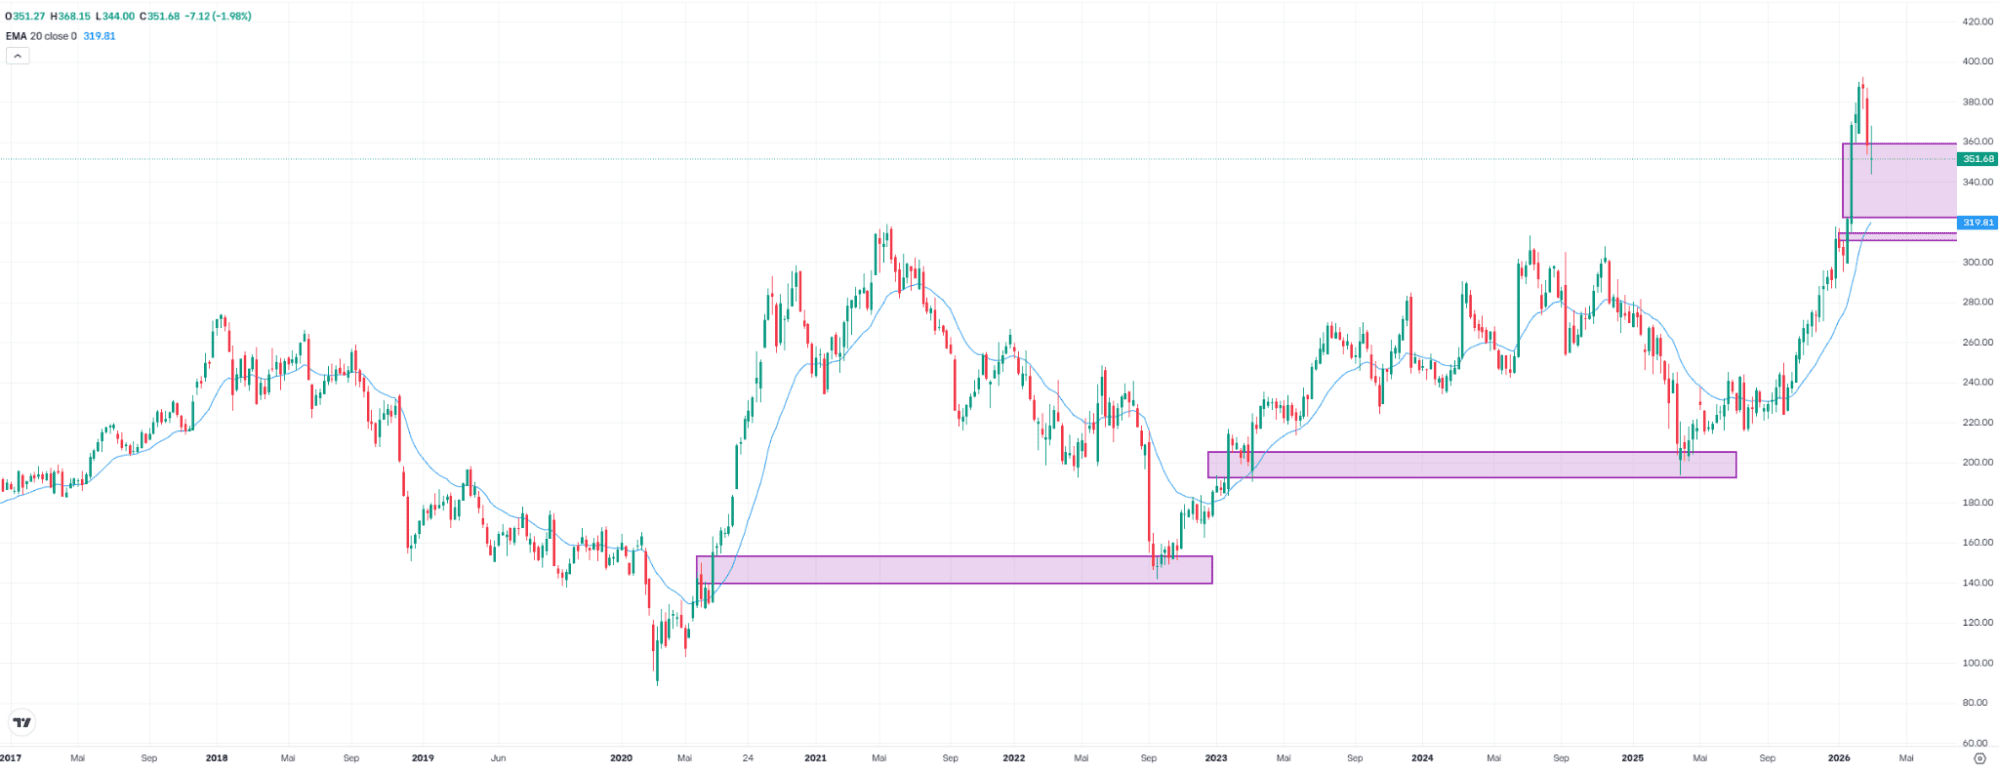
FedEx, weekly chart. Source: eToro
Crypto: What’s next?
Over the past days, the crypto asset market has delivered mixed signals. While the prices of bitcoin and ethereum remain within defined ranges under negative investor sentiment, capital flows and institutional movements point to deeper dynamics that deserve close attention.
One relevant signal is the purchase of more than 4,000 BTC in a single day by Strategy, financed through preferred shares. This reflects how institutional capital is beginning to use credit structures to accumulate bitcoin and integrate it into corporate balance sheets, generating demand capable of absorbing several times the network’s daily issuance after the halving, which is currently about 450 BTC per day.
Another key indicator comes from bitcoin ETFs, which closed the week with five consecutive sessions of net inflows. In March alone, around 20,000 BTC have already been purchased through these vehicles. While this is not yet a definitive signal of a trend reversal, it suggests a stabilization in institutional demand.
Whale behavior appears divided. Some large addresses have reduced positions while others continue accumulating, indicating more of a rebalancing and profit-taking phase than a broad distribution process.
Ethereum shows a slightly different dynamic. Despite more positive investor sentiment linked to expected network improvements, on-chain data reveal increased selling activity from some large addresses, reflected in higher ETH inflows to exchanges that could signal short-term selling pressure. At the same time, some whales continue making significant purchases, suggesting ongoing medium-term positioning.
The divergence between investor sentiment and on-chain data is notable. The Fear & Greed index places bitcoin sentiment in “extreme fear,” reflecting pessimism among retail investors. However, on-chain flows do not indicate capitulation but rather a market where tactical selling coexists with selective accumulation.
Overall, the current market narrative rests on three main ideas: the ongoing institutionalization of bitcoin, a consolidation phase following previous gains, and the continued expansion of financial infrastructure around digital assets. At the same time, the regulatory environment is becoming clearer, with growing coordination between the SEC and the CFTC that could support the development of new crypto-linked financial products.
In this context, the market appears to be in a digestion phase rather than one of euphoria or capitulation. Prices are moving sideways while more sophisticated capital continues to position cautiously. The key levels to monitor are $75,000 as resistance and $65,000 as short-term support.
This communication is for information and education purposes only and should not be taken as investment advice, a personal recommendation, or an offer of, or solicitation to buy or sell, any financial instruments. This material has been prepared without taking into account any particular recipient’s investment objectives or financial situation and has not been prepared in accordance with the legal and regulatory requirements to promote independent research. Any references to past or future performance of a financial instrument, index or a packaged investment product are not, and should not be taken as, a reliable indicator of future results. eToro makes no representation and assumes no liability as to the accuracy or completeness of the content of this publication.