


The Daily Breakdown looks at the key events for the daily, including big earnings and notable econ events. Then, we look at Nvidia’s chart.
Before we dive in, let’s make sure you’re set to receive The Daily Breakdown each morning. To keep getting our daily insights, all you need to do is log in to your eToro account.
What’s Happening?
It’s been a tough couple of months for economists. The record-long government shutdown created major delays and left key figures missing, and the data we have received has often disappointed — including last week’s ADP report and JOLTS update, as well as this week’s December retail sales report.
Against that backdrop, January’s jobs report was a welcome surprise. Payrolls rose by 130K, roughly double economists’ expectations. The unemployment rate dipped from 4.4% to 4.3%, and average hourly earnings posted a solid gain.
What About Rates?
With labor-market concerns mounting, this is the type of report investors should embrace — even if it gives the Fed more room to keep rates on hold. A modest decline in interest rates isn’t worth a meaningful deterioration in employment.
Still, perspective matters. This is one data point, and it doesn’t erase the recent softness elsewhere. But if the labor market is stabilizing, that would be constructive for both the economy and the market.
Up Next: Friday’s CPI inflation report at 8:30 a.m. ET. For earnings, Coinbase, Airbnb, DraftKings, and Arista Networks will report tonight, among others.
Want to receive these insights straight to your inbox?
The Setup — Nvidia
After an impressive rally, Nvidia has been rangebound for months. Despite strong spending outlooks from Magnificent 7 holdings like Microsoft, Alphabet, and Meta, Nvidia stock continues to trade between $170 and the mid-$190s.
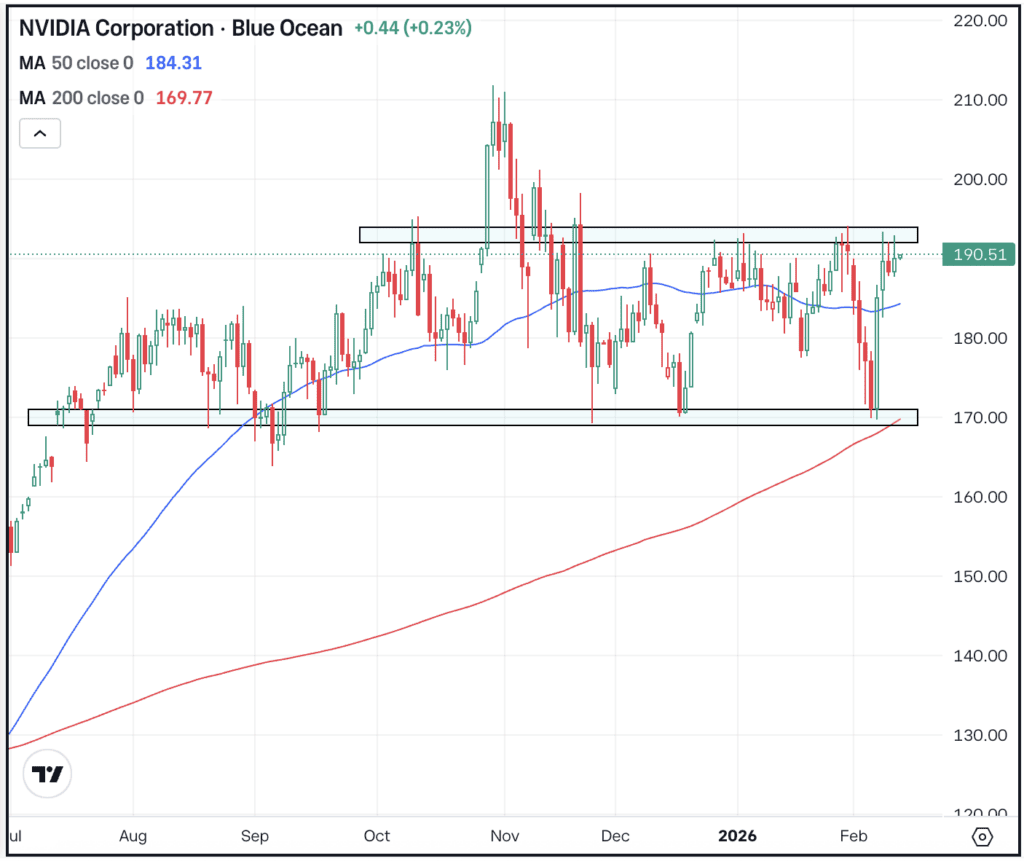
Notice how the 50-day moving average has flattened out — trendless — as Nvidia stock wavers both above and below it, while staying above the 200-day moving average, which shows a stronger long-term trend. If NVDA can clear the mid-$190s and regain $200, bulls might look for a charge back toward its record highs from October. Should resistance hold firm, support near $170 and the 200-day moving average could be in play if selling pressure accelerates.
For more technical analysis know-how, check out our recent Boot Camp!
Options
As of February 11th, the options with the highest open interest for NVDA stock — meaning the contracts with the largest open positions in the options market — were the March $200 calls.
Investors who are bullish could consider calls or call spreads as one way to speculate on further upside, while bearish investors could consider puts or put spreads to speculate on a further move to the downside. For options traders, it may be advantageous to have adequate time until the option’s expiration.
To learn more about options, consider visiting the eToro Academy.
What Wall Street’s Watching
ETH
Ethereum is moving higher on Thursday, up about 2.5%. Bulls are hoping that last Friday’s rally has sparked a rebound in ETH and will continue to power a further move higher as it contends with the $2,000 level. ETHA — which remains the largest ETF by assets, while also supporting options trading — is also in focus.
CAT
Shares of Caterpillar continue their post-earnings rally, with a 4.4% gain on Wednesday that vaulted the stock to record highs. CAT is riding a four-day win streak, up more than 14% in that stretch, while shares are up more than 20% since it reported in late January. Dig into the fundamentals for CAT.
CSCO
Cisco Systems is moving lower this morning despite the company delivering better-than-expected earnings and revenue results. Earnings guidance for the current quarter was in-line with estimates, while revenue was slightly ahead of analyst expectations. Shares had rallied more than 20% from January 21 to this week’s record high. Check out the chart for CSCO.
Disclaimer:
Please note that due to market volatility, some of the prices may have already been reached and scenarios played out.