


Advanced Charts For Better Decisions
Take your trading to the next level with the most advanced charting tools available
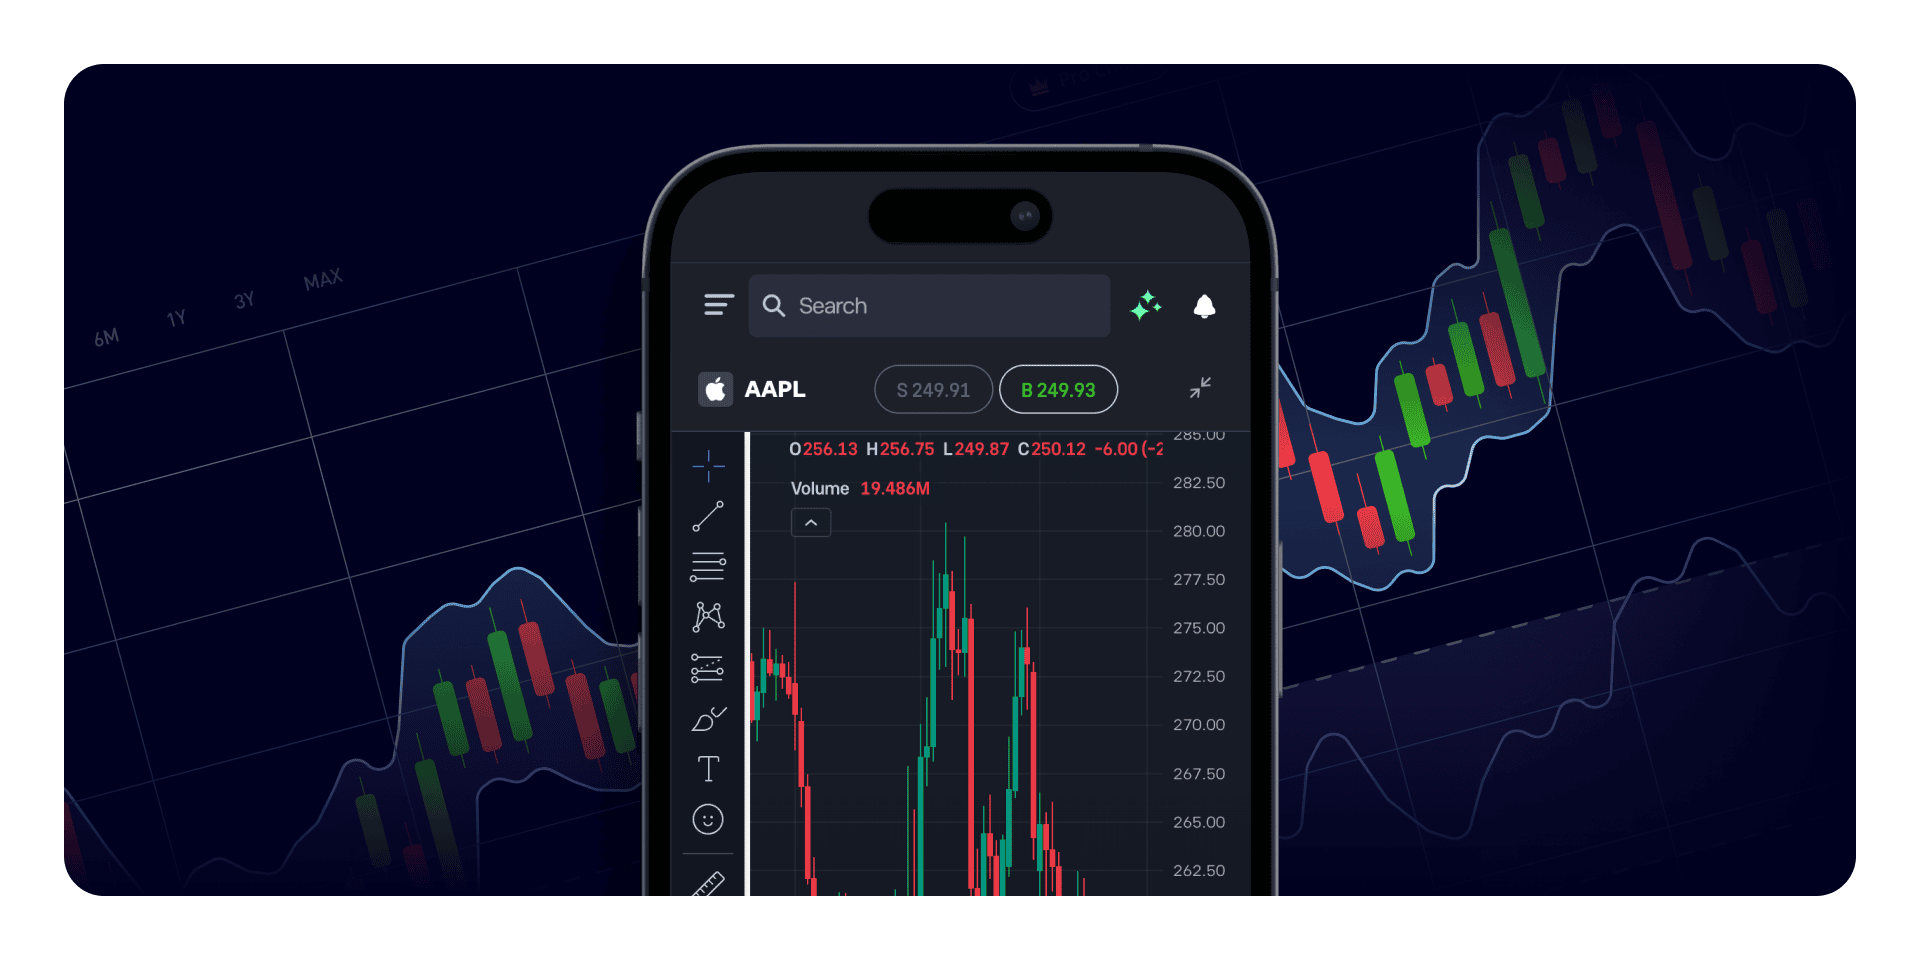
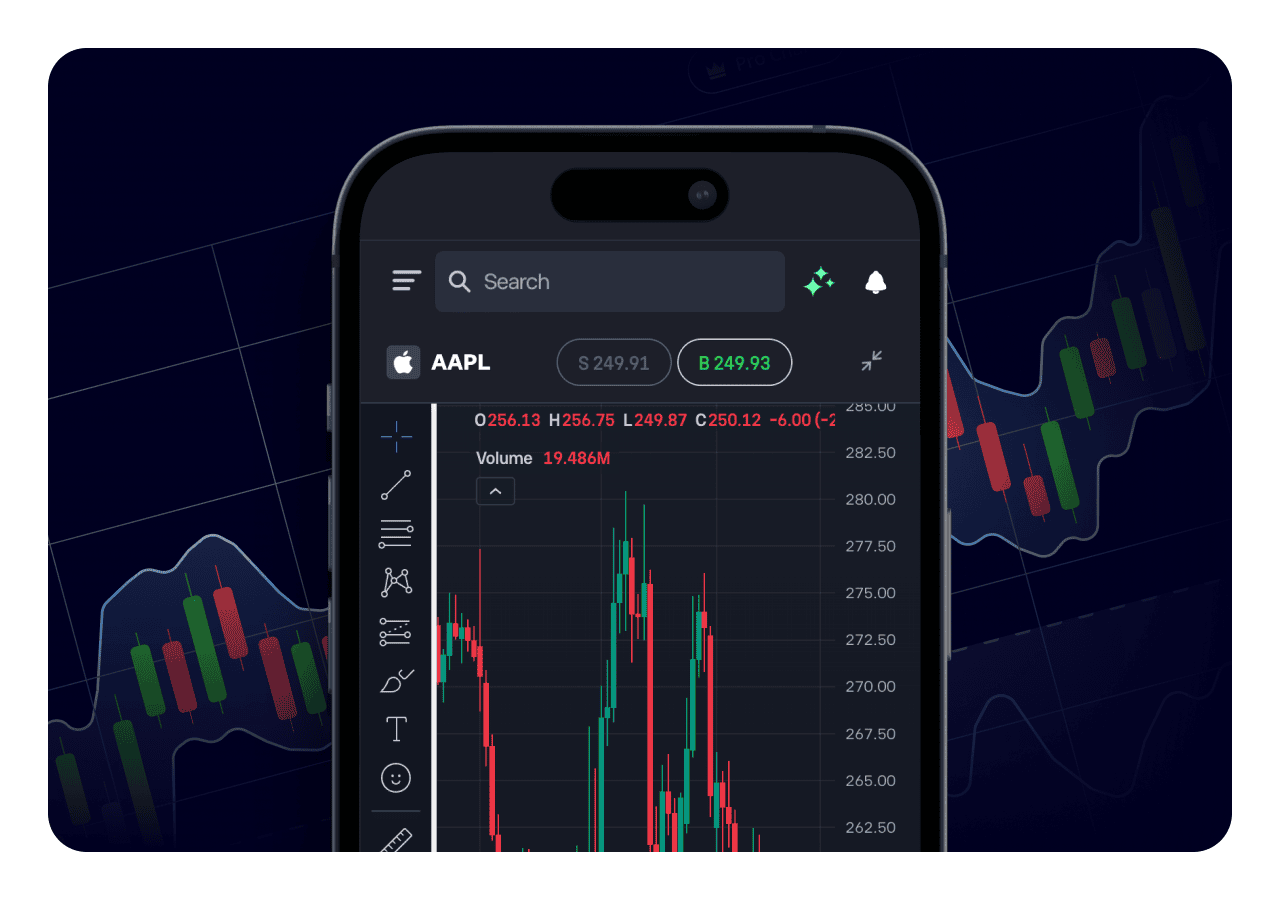
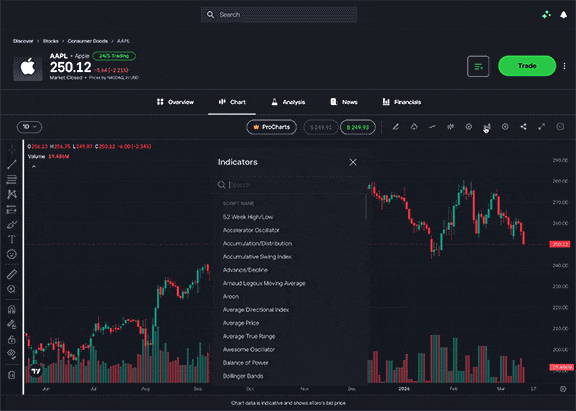
Technical analysis done right
When you have the right tools, leveraging up-to-the-moment data to make well-
informed trading decisions comes naturally.

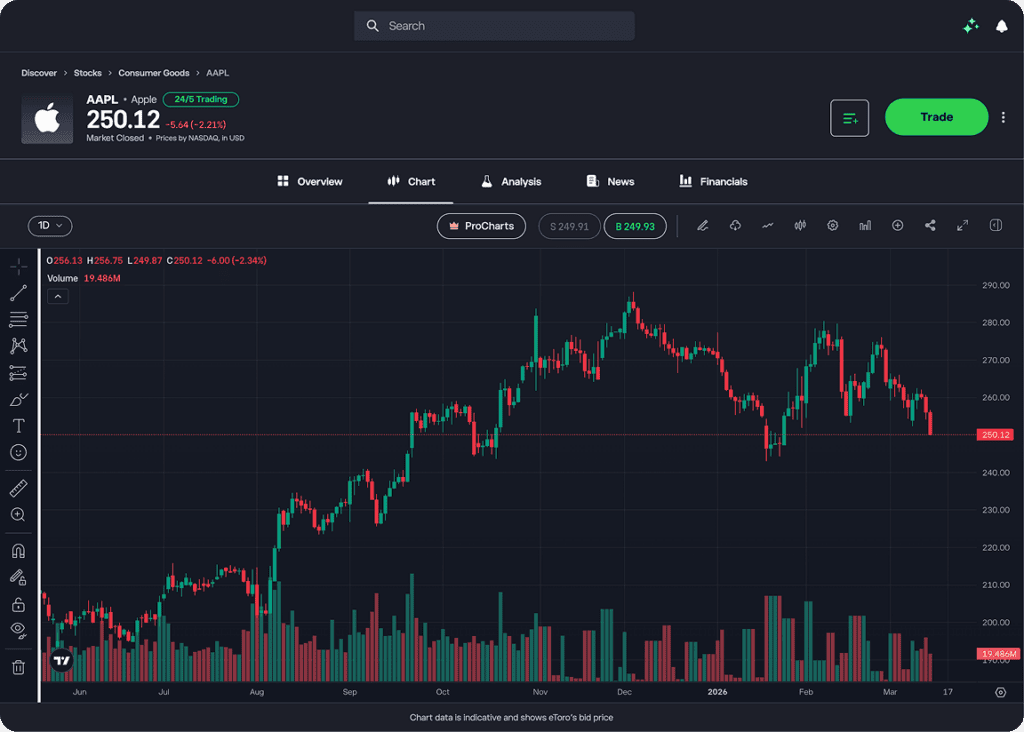
Powerful state-of-the art charts update live in real time multiple times per second, so you never miss a beat.

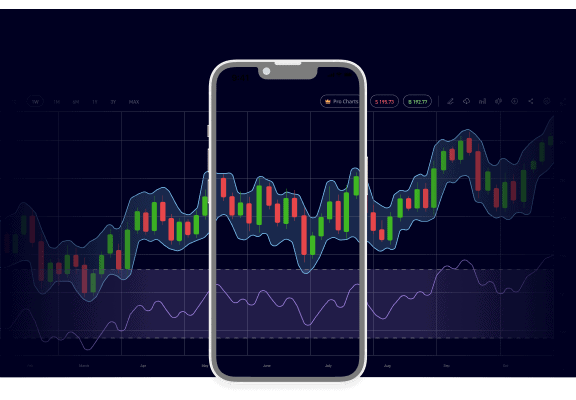
Clear, easy-to-read visuals – even on mobile – allow you to take action quickly when time is of the essence.

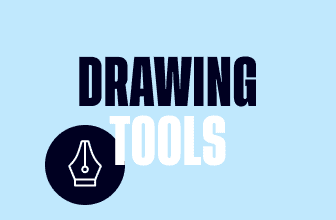
7 chart types, 50+ drawing tools, and 100+ indicators let you plan smarter and save templates for easy access.
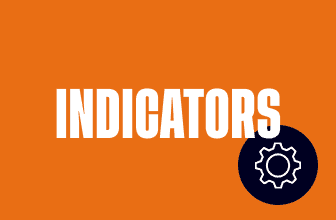
Never miss a trend
Analyse the markets from different perspectives with over a hundred of the most popular indicators to help you anticipate opportunities, whatever your strategy may be.
Your charts, your way
Set up charts to reflect your preferences using easily customisable layouts and templates. Once you have your ideal charting view, simply save it for quick access any time.
Come to the dark side…
Dark Mode offers benefits that enhance your user experience:
- Reduces strain on the eyes, especially for extended periods
- Improves battery life of mobile devices
- Many users find Dark Mode more pleasing, making trading more enjoyable
How do I use TradingView charts on eToro?
Watch the videos below to learn the basics of using our advanced charts for
technical analysis
eToro Club member? Get even more
Check out what our charts offer in the table below. An eToro Club membership
unlocks access to even more tools and features!
| eToro Club exclusive access | All eToro users | |
|---|---|---|
| Charts | ||
| Pro Charts | ||
| Multi-Chart Layouts | ||
| Templates | ||
| Dozens of Analysis tools | ||
| Alerts | ||
| 50+ Smart Drawing Tools | ||
| Custom Time Intervals | ||
| Custom Range Bars |
Ready to take your trading to the next level?
FAQ
- What is technical analysis?
-
Technical analysis studies short-term indicators to identify potentially profitable opportunities in the financial markets. These indicators are often identified on trading charts using candlestick and other chart type patterns. Technical analysis can be done for any financial instrument with historical trading data.
For more information on technical analysis, click here.
- How does technical analysis work?
-
Technical analysis aims to use previous price patterns to predict future movements. Traders forecast price movements by using technical analysis indicators.
There are hundreds of technical indicators, but the main technical analysis indicators are:
* Price Trends
* Moving Averages
* Support and/or Resistance Levels
* Charting Patterns
* Momentum and Volume IndicatorsFor more information, check out our Complete Guide to Stock Indicators and our Guide to Popular Technical Analysis Tools.
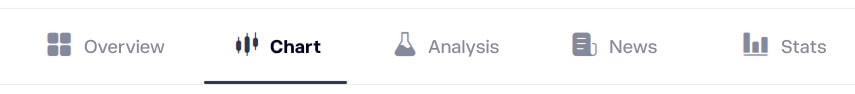
- How can I access charts on the platform?
-
Go to any asset page and click on the “Chart” tab at the top.
- Which chart types are available?
-
* Candlesticks
* Bars
* Area
* Line
* Baseline
* Hollow Candles
* Heikin-Ashi