


Analyst Weekly, May 4, 2026
Markets are still taking their cues mostly from earnings rather than macro headlines, with company results setting the tone for risk appetite. This week, that focus sharpens as fresh data from both sides of the Atlantic offers a clearer read on where growth is actually holding up and where it’s starting to fade.
Around 80% of S&P 500 companies have beaten earnings expectations so far, with profits up roughly +31% year-on-year. This is a meaningful upside surprise versus what analysts pencilled in.
Revenue is holding up too, growing ~11%, with most sectors participating. But the leadership is clear:
- Tech, communication services, and consumer discretionary are doing the heavy lifting
- Financials are quietly contributing
- 9 out of 11 sectors are still printing double-digit earnings growth
Investment takeaway: Even strip out the “Mag 7,” and earnings are still up close to 20%. This is broad enough to support equities, but still growth-led. You’re being paid to stay invested, but sector selection matters.
Cyclicals are back.
Outside of mega-cap tech, cyclical sectors are starting to outperform defensives, a shift that hasn’t been consistent in recent quarters.
Investment takeaway:
- Growth is stabilizing (not collapsing)
- Investors are rotating into economically sensitive names
- The market is pricing a “soft-ish landing” scenario
If cyclicals keep gaining traction, the rally broadens.
Europe: Slower engine, mixed signals
Earnings are landing but the gap between the US and Europe is widening.
About 59% of companies are beating earnings, with profits up +5% YoY. That’s a positive surprise but barely.
The bigger issue is the top line:
- Revenues are flat
- Less than half of companies are beating sales estimates
- Several sectors are seeing outright declines
Under the hood:
- Energy and tech are bright spots (double-digit growth)
- Financials are helping
- Consumer discretionary is weak
- Healthcare is slipping into negative earnings growth
Investment takeaway: Europe is a margin story, not a growth story. Earnings are holding up, but without revenue momentum, upside is capped.
It is not all clean: guidance is messy
Overall, companies across sectors are flagging:
- Higher fuel and energy costs
- Geopolitical disruptions (Middle East tensions showing up repeatedly)
- Soft consumer demand in pockets
- China weakness for global brands
This isn’t showing up fully in earnings yet but it’s creeping into forward guidance.
Palantir struggles with resistance ahead of earnings
Palantir shares barely moved last week, gaining just 0.7% and closing at $144 on Friday. Ahead of today’s after-hours earnings, there is not only caution in the market, but also a noticeable level of technical tension. The situation has clearly tightened. About four weeks ago, a potential bottom formed around $125, although it still needs confirmation. At the same time, multiple lower highs are visible, along with repeated failed breakouts at the 20-week moving average, which currently sits around $150.
For a sustainable recovery, the stock would need to break above both this moving average and the resistance area around $162. The gap to the all-time high currently stands at around 33%. If the breakout fails, another pullback toward the short-term support zone becomes likely. Should that level fail to hold, the area between $99 and $109 comes into focus as the next potential support zone, also known as a fair value gap.
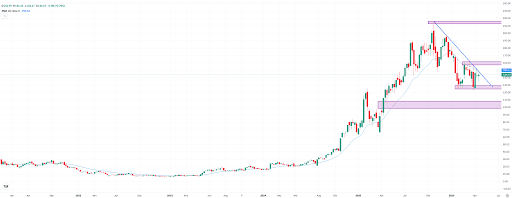
Palantir, weekly chart. Source: eToro
Has AMD stock run too hot ahead of earnings?
AMD will also report earnings this week, specifically on Tuesday after the close. The stock just reached a new all-time high above $360 last week. The long lower shadow of the previous week’s candle points to elevated short-term volatility. While buyers ultimately prevailed, there is a strong chance that volatility will persist for now.
After eight consecutive weeks of gains and a rally of around 95% from the March low, the stock is vulnerable to a stronger pullback. Such declines are not only normal, but often healthy, as they can provide more attractive entry opportunities for potential buyers. If the stock comes under pressure, two key zones come into focus. First, the broad fair value gap between $280 and $310. Second, the breakout level below that, around $266. Only a drop below the 20-week moving average at approximately $242 would seriously call the broader uptrend into question.
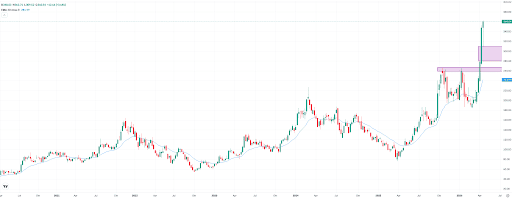
AMD, weekly chart. Source: eToro
Bitcoin rises quietly: institutional demand rewrites the market structure
Bitcoin is trading around $78K USD in a recovery phase that has not yet been validated, but with an underlying shift that the market continues to misread. April closed as the best month of the year (+11.8%), with approximately $2.44B USD in net inflows via ETFs and around $5B USD in corporate accumulation. The signal clearly indicates that price is no longer driven by retail investors.
The apparent contradiction of price rising without spot volume is resolved by the data: demand is not missing, it has simply changed hands. The flow has not disappeared; it has shifted toward ETFs, OTC, and corporate balance sheets, diluting the traditional market footprint.
This nuance is critical because it redefines the cycle. Bitcoin is ceasing to behave as a speculative asset and is moving toward a reserve asset. This is not narrative; it is measurable capital allocation. In this cycle, moreover, institutional capital is not rotating into ETH or altcoins but is concentrating in BTC, where the monetary thesis is simpler and fits better within traditional portfolios.
The macro context adds short-term pressure but at the same time reinforces the thesis: in an environment of persistent inflation, non-sovereign assets gain weight as a strategic reserve.
On-chain, the setup is consistent with accumulation phases, with exchange supply declining (170,000 BTC over 6 months), negative funding (−5%), and low open interest (around $7.3B USD). This implies short-term traders are positioned short and there is potential for a squeeze or margin calls if a bullish catalyst emerges. This is not a weak market; it is a constrained one.
Thus, in the midst of a transfer of market participants, the key level to break stands at $80,000 USD as a technical level and $87,000 USD as a structural level. On the downside, $73,000 USD marks the first relevant control reference. Until then, we remain in a construction phase, and everything points to maintaining exposure, avoiding leverage, and waiting for structural confirmation rather than anticipating it.
This communication is for information and education purposes only and should not be taken as investment advice, a personal recommendation, or an offer of, or solicitation to buy or sell, any financial instruments. This material has been prepared without taking into account any particular recipient’s investment objectives or financial situation and has not been prepared in accordance with the legal and regulatory requirements to promote independent research. Any references to past or future performance of a financial instrument, index or a packaged investment product are not, and should not be taken as, a reliable indicator of future results. eToro makes no representation and assumes no liability as to the accuracy or completeness of the content of this publication.